
Figure 5. For example 5 this shows, for female ages at the start of the attempt to conceive, of 25, 30, 35 and 40: (A) the probability of conceiving on the next cycle for a couple who have not yet conceived, and (B) the cumulative conception probability.
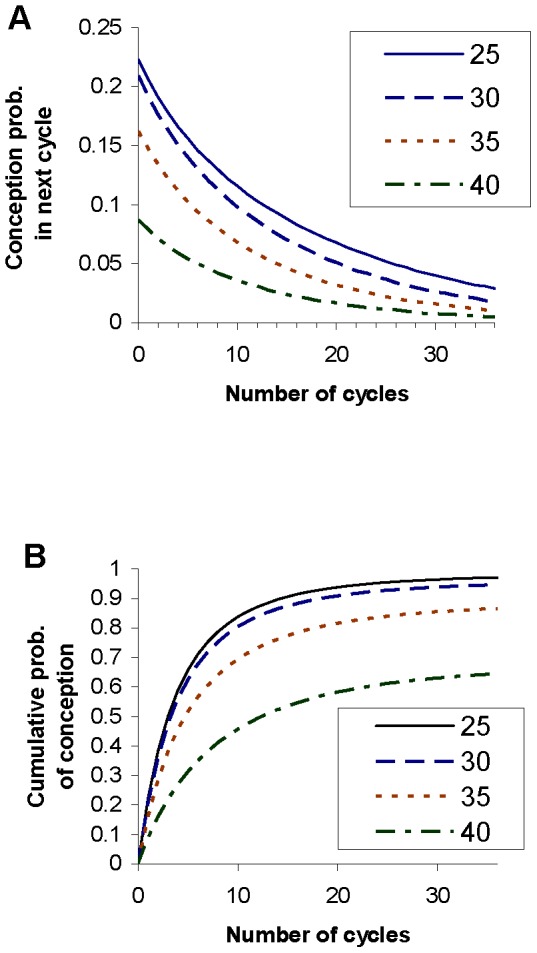
They are plotted as a function of the number of cycles of attempted conception.