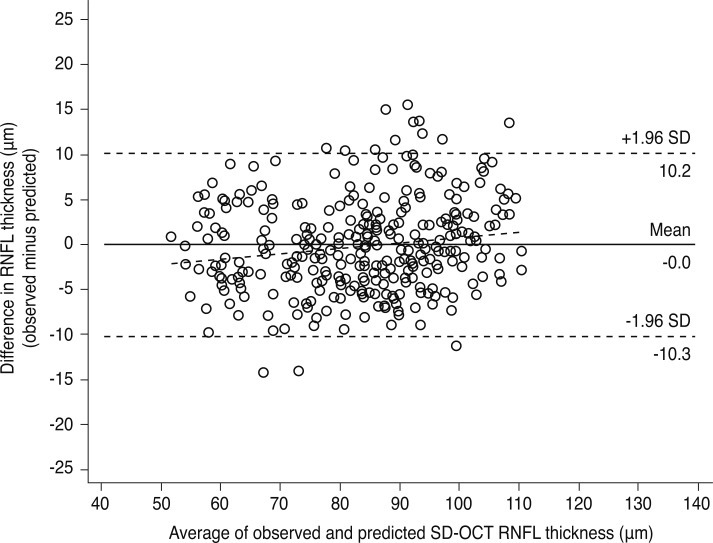
Fig. 4.
Bland-Altman plot showing observed versus predicted spectral domain (SD)-optical coherence tomography (OCT) retinal nerve fiber layer (RNFL) thickness. The difference between both measurements is plotted against the average of both measurements (slope = 0.060, p = 0.004). Mean difference ± standard deviation: observed minus predicted, -0.04 ± 5.22 µm; 95% confidence interval, -0.61 to 0.53; limits of agreement, -10.3 to 10.2 µm).

