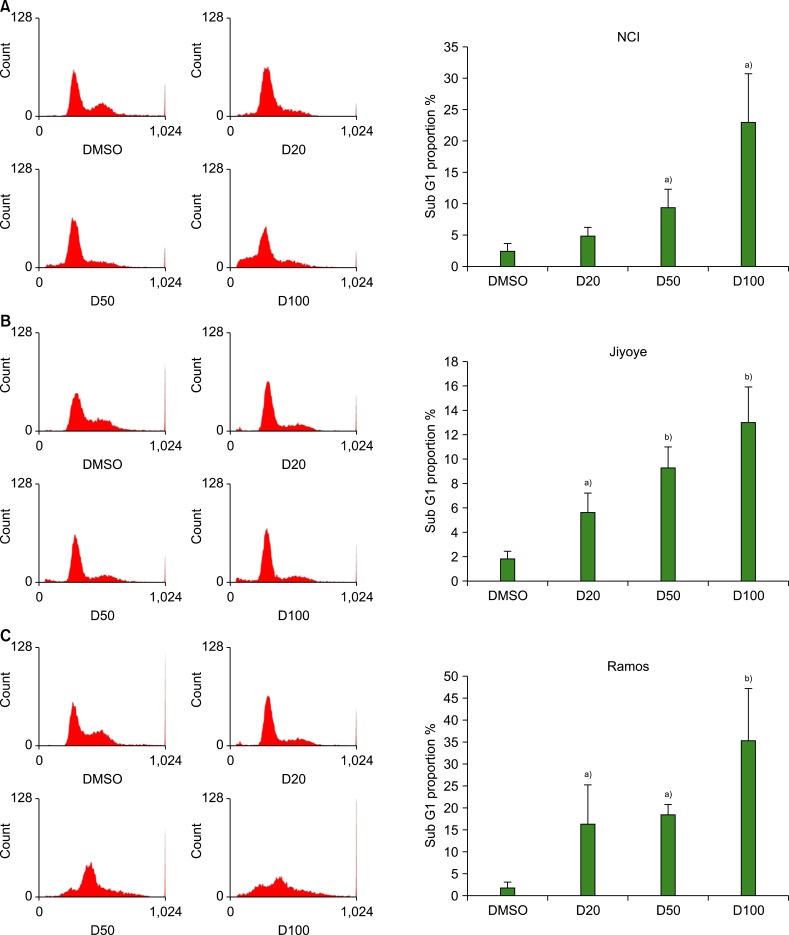
Fig. 2.
Flow cytometry analysis results show that deferasirox treatment increased the percentage of cells in sub-G1 phase in a dose-dependent manner. (A) NCI H28:N78 cells, (B) Jiyoye cells, and (C) Ramos cells. The results are presented as mean (SD) percentage of cells in sub-G1 from triplicate experiments (a)P<0.05, b)P<0.01).

