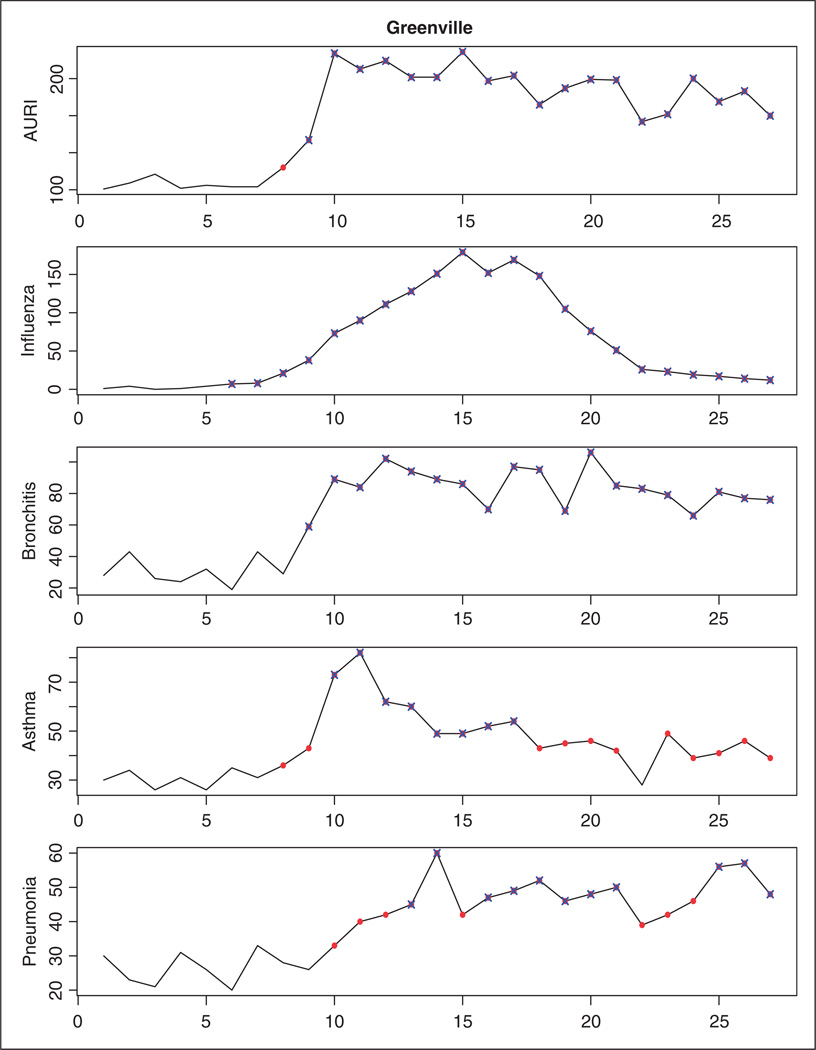
Figure 5.
Temporal profile for the Greenville county. Time points corresponding to outbreak periods as detected by the multivariate surveillance conditional predictive ordinate are represented by solid points. Unusual observations based on the univariate surveillance technique are represented by crosses.

