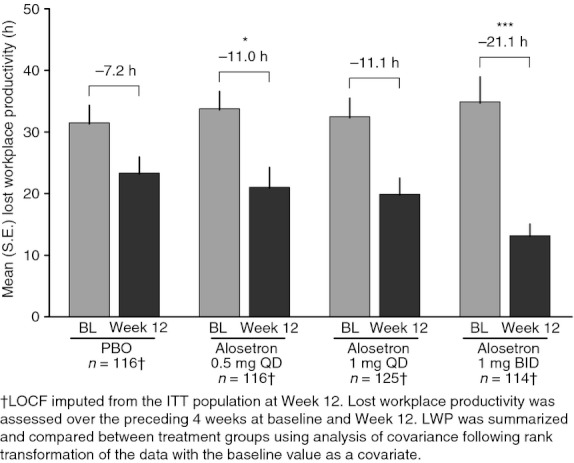
Figure 2.

Mean number of hours of lost workplace productivity at baseline and Week 12 for the placebo (PBO) and alosetron treatment groups. BL, baseline; QD, once daily; BID, twice daily. *P < 0.05, ***P < 0.001, significantly different from placebo.
