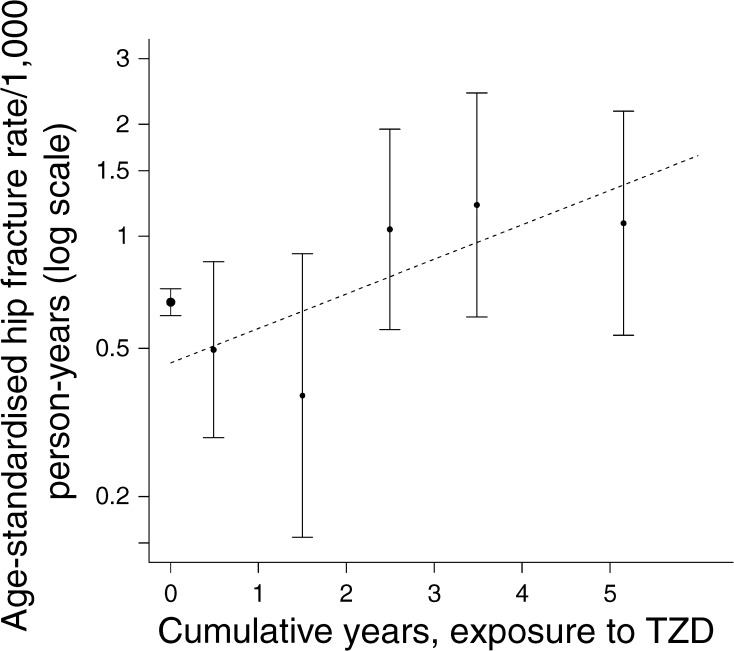
Fig. 1.
Age-standardised rates of hip fracture by cumulative exposure to TZD in women. The error bars indicate the 95% CI for the rates. The x axis shows cumulative years of exposure; the data point at x = 0 is for all unexposed person time-periods, and the other data points are for exposure categories 0 < x ≤ 1, 1 < x ≤ 2, 2 < x ≤ 3, 3 < x ≤ 4 and x > 4 years. The dotted regression line shows the linear effect of cumulative exposure (x) calculated by weighted least squares from the ever-exposed data points as an approximation to the modelling approach described in the Methods. Whereas the data point at x = 0 is the log fracture rate observed for all unexposed person time-periods, the point on the dotted regression line where x = 0 is the estimate from the model of the log fracture rate at the point of starting exposure in those exposed. Thus the difference in height between these two points gives the magnitude of the ever-exposed term and is the sum of any immediate stepwise effect of the drug and any difference in prior risk of fracture in ever vs never exposed. Since an immediate stepwise effect of TZD on hip fracture is unlikely the difference in height suggests that those who become exposed have a lower prior fracture risk than the never exposed

