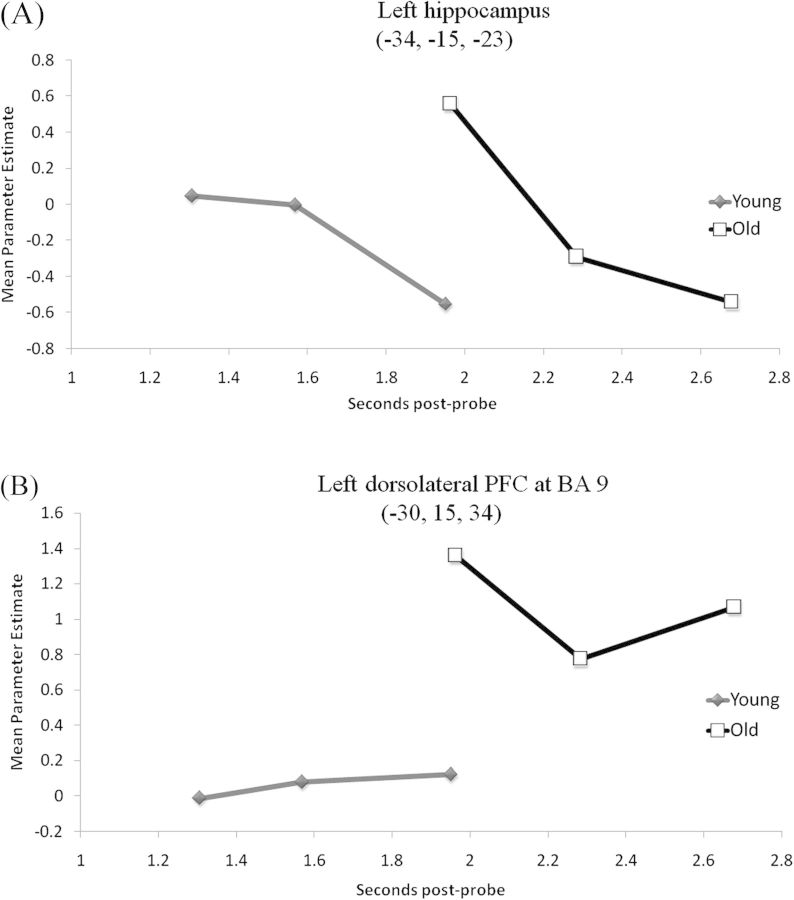
Figure 3.
Parameter estimates of mean activation levels in the MTL and PFC regions that showed the ELSA pattern, plotted as a function of behavioral RT. The magnitude of activity in left hippocampus (A) decreased in slower trials in both age groups, while activity in left DLPFC (B) showed no distinct relationship with RT.

