Figure 3.
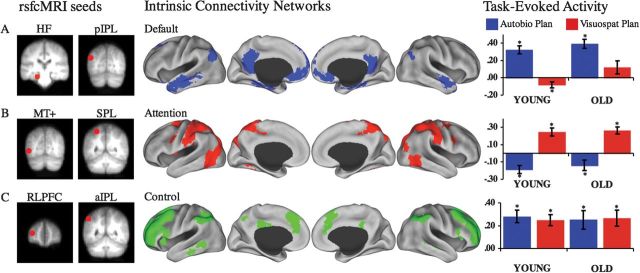
Resting-state functional connectivity analysis. Seed regions used to compute the correlation maps are shown to the left of the (A) default, (B) attention, and (C) control intrinsic connectivity networks. Task-evoked BOLD signal mean and standard error of the mean within each intrinsic connectivity network ROI is on the right. Y-axis = BOLD signal change within each ROI. Task-evoked activity demonstrate that (A) the default network was primarily engaged by autobiographical planning but only suppressed in the young for visuospatial planning (B) the attention network was primarily engaged by visuospatial planning and suppressed during autobiographical planning, (C) the control network was primarily engaged by activity underlying both planning tasks. * indicates significant task difference in BOLD signal from baseline. HF, hippocampal formation; pIPL, posterior inferior parietal lobule; MT+, middle temporal motion complex; SPL, superior parietal lobule; RLPFC, rostrolateral prefrontal cortex; aIPL, anterior inferior parietal lobule.

