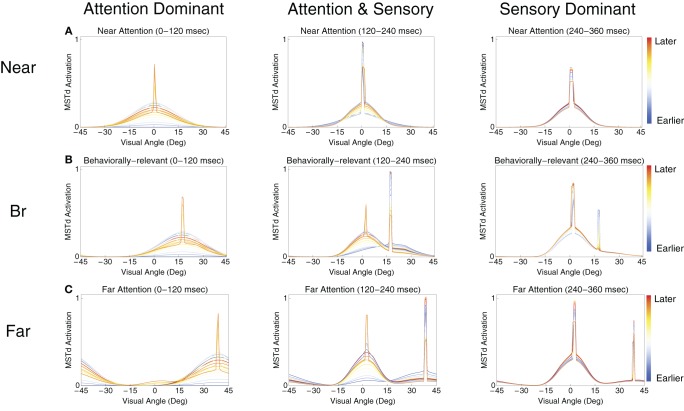
Figure 5.
The spatial dynamics of the model MSTd heading template match layer. (A–C) Show the temporal evolution of MSTd cells in the near, behaviorally-relevant, and far conditions, respectively. Each subplot contains snapshots of the network activity at uniformly sampled times within 120 ms intervals. From left to right, the plots show snapshots from contiguous 120 ms intervals. The FoE is located in the center of the visual display (0°). We call the cells primarily influenced by the sensory optic flow (left peak) and attentional (right peak) signals the sensory subpopulation and attentional subpopulation, respectively.

