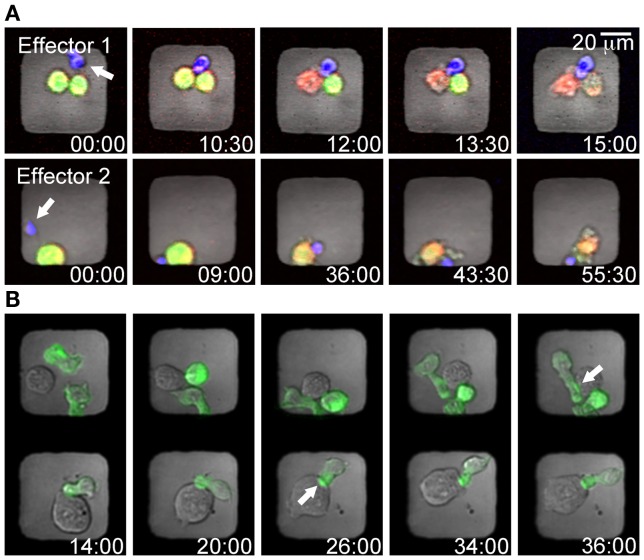
Figure 3.
Examples of cell labeling strategies to detect NK mediated cytotoxicity or cell–cell interactions in microwells. (A) Time-lapse series showing two wells containing individual NK cells (blue) killing tumor target cells (yellow). Target cells were stained with the cytosolic dye calcein (green) and the red cell tracer dye DDAO (red); hence the killing events can be detected by lysed target cells changing color from yellow to red. (B) To detect the dynamics of immune synapse formation B cells expressing GFP-labeled MHC I molecules (721.221/Cw6-GFP, green) were co-incubated with NK cells (YTS/KIR1, unstained). The timing of immune synapse formation in cell conjugates trapped in adjacent wells was assessed by monitoring clustering of the MHC I-protein (green) at the intercellular surface (white arrows).

