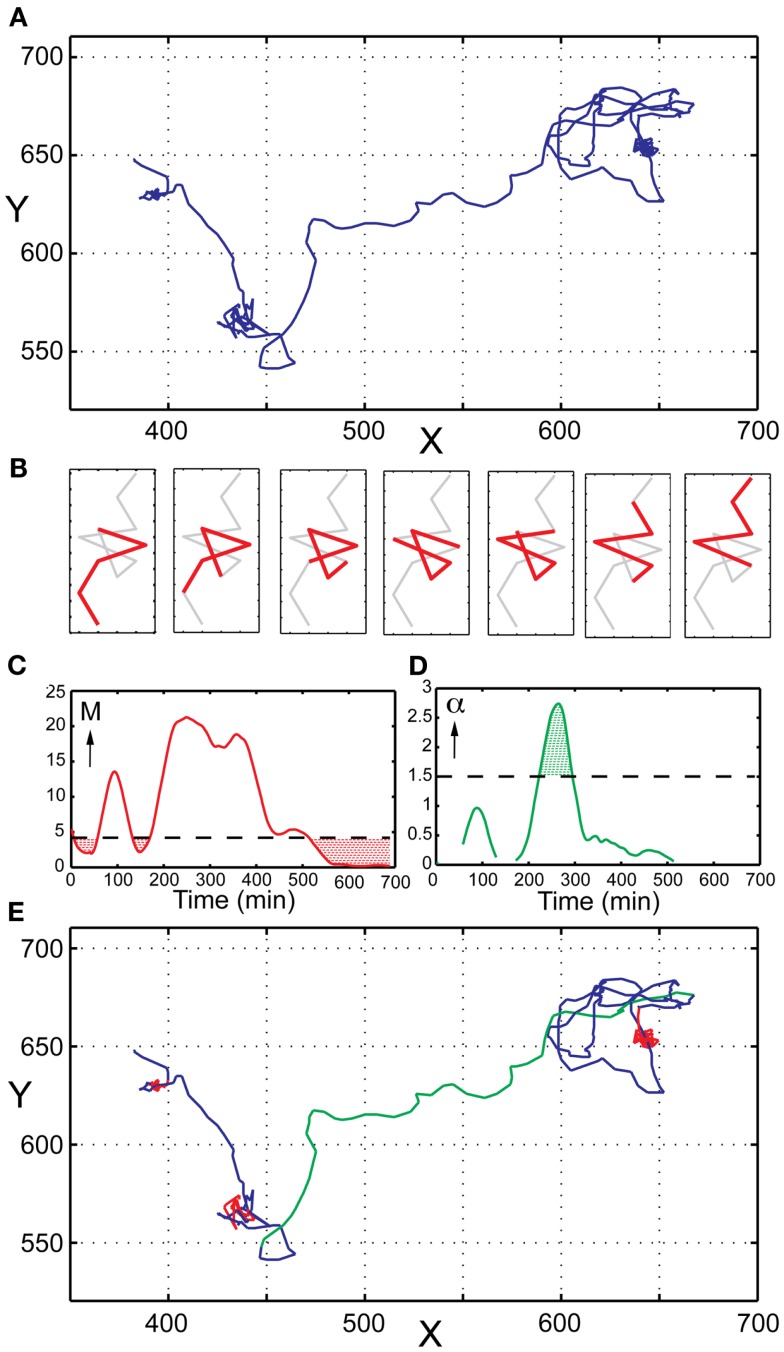
Figure 4.
Analysis of transient migration behavior. (A) Trajectory of a single human primary NK cell imaged in a microwell. (B) Schematic representation of the sliding window approach to migration analysis. Only a small part of the trajectory is analyzed at a time (here represented by five consecutive point shown in red). Step-by-step a new segment is analyzed until the whole trajectory has been covered. (C) TMAPs occur when M is below the threshold value (red dotted areas). (D) Directed migration occurs when α is higher than the chosen threshold value (here α = 1.5) for 10 successive time points. (E) Same NK cell trajectory as in (A) with indicated modes of migration; random movement (blue), TMAPs (red), and directed migration (green).

