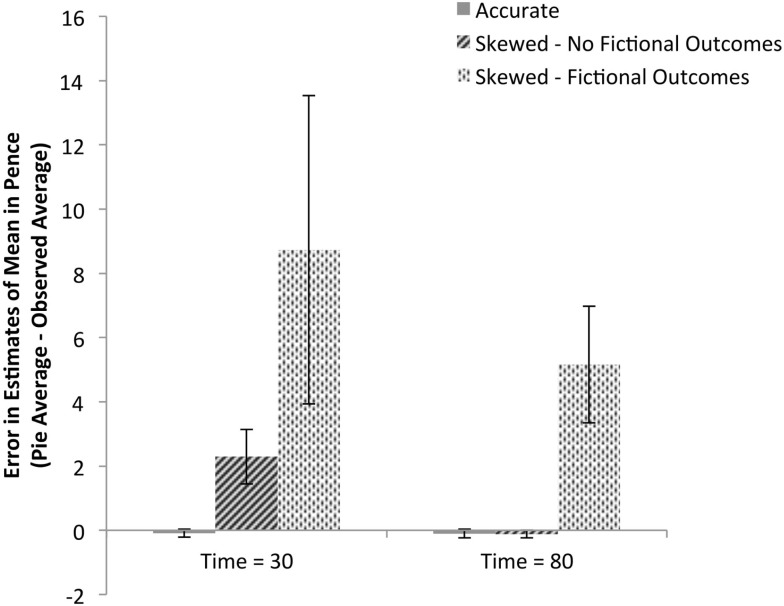
Figure 4.
Mean error in payout estimation based on condition and belief in fictional outcomes. Each participant’s mean observed payout for each machine was subtracted from each participant’s pie chart estimate of mean payout for that machine to calculate errors in estimation. The data are split based on whether the participant persisted throughout the game in including the fictional higher-value outcomes of 15, 20, 25, and 100 pence; 8 of 26 participants given skewed payout tables included the fictional outcomes; no participants given accurate payout tables did so. Values greater than zero indicate overestimation and values close to zero indicate accurate estimation. Errors for both the left and right machines were averaged resulting in one error measure per participant per judgment during machine play.

