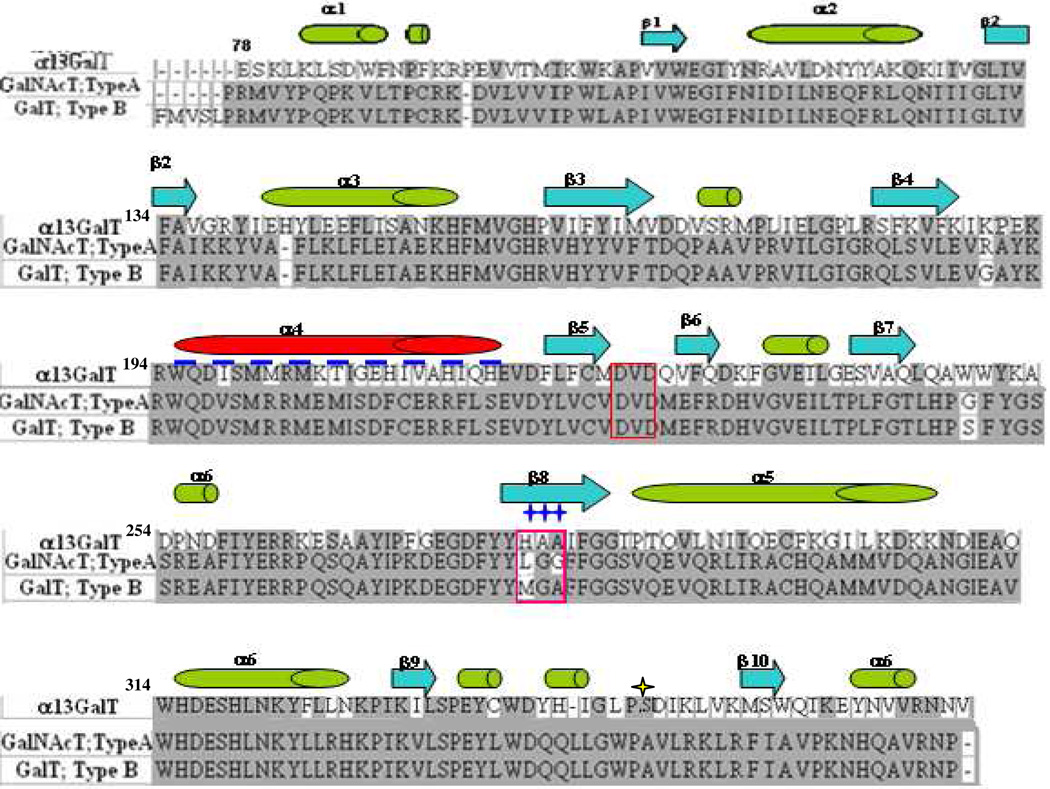
Figure 1.
Sequence comparison of the catalytic domain of α3Gal-T with the blood group A and B transferases. The DVD motif (red box) and the sugar donor binding site residues (pink box) are labeled. Secondary structural motifs of these proteins are shown above the sequence; green and red tubes indicate alpha helix; blue arrows indicate beta strands; dashed navy line indicates missed internal loop in blood group A and B transferase structure. Sites of mutation of α3Gal-T are indicated by navy stars at positions 280–282.

