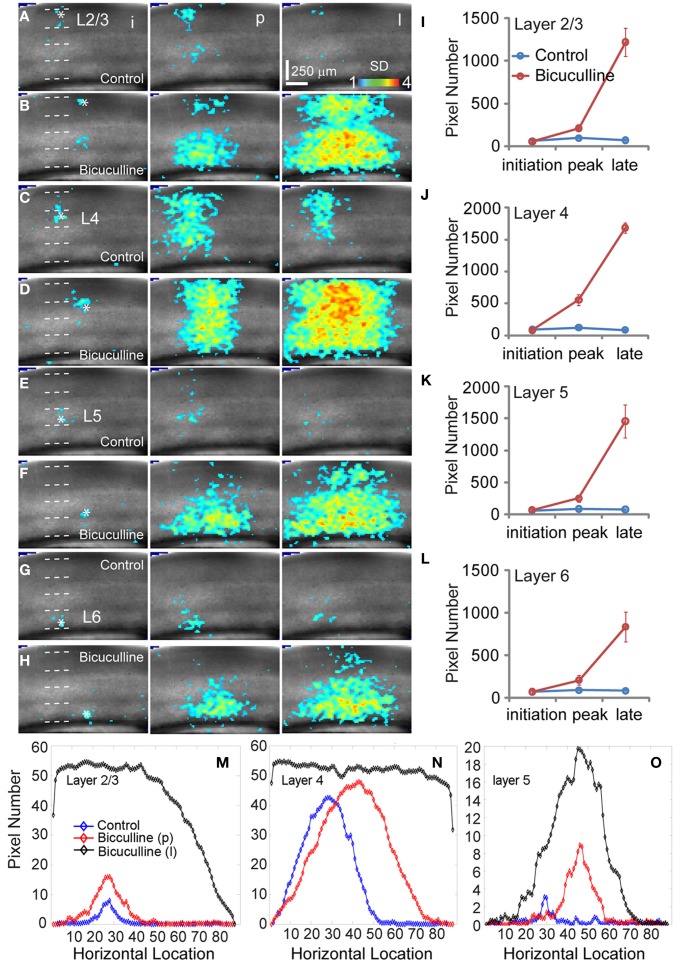
Figure 4.
Effects of antagonizing GABAa receptor activity with bicuculline on the spatiotemporal dynamics of local V1 circuit activity. (A,C,E, and G) show individual image frames corresponding with the initiation (i), peak (p), and late phase (l) of the VSD activation, in response to photostimulation in normal ACSF in layers 2/3, 4, and 5 of a V1 slice, respectively. In comparison, (B,D,F, and H) show activation frames of the same slice re-mapped with the addition of bicuculline in ACSF, evaluated at the three temporal phases of the VSD activation, respectively. Note that 1 ms photostimulation was used for control, while 0.5 ms photostimulation was used in the bicuculline presence. (I–L) Show the average number of activated pixels at the initiation, peak, and late phases of control and bicuculline treated slices (N = 2). Data are presented as means ± SE. When the datasets of five slices were pooled, the response differences between control and blocking cortical inhibition were significant statistically (P < 0.05) at the peak and late phases across all the layers, but not significant for the initial phase (P > 0.5). (M–O) Show slice activation profiles of the peak phase of control, and the peak and late phases of bicuculline application for layers 2/3, 4, 5, and 6, respectively. For the plots, the x axis indicates horizontal location of activated pixels from the left to right of the image frame (in the unit of pixel); the y axis denotes the average number of column-wise summed activated pixels across image frames at the defined phases.

