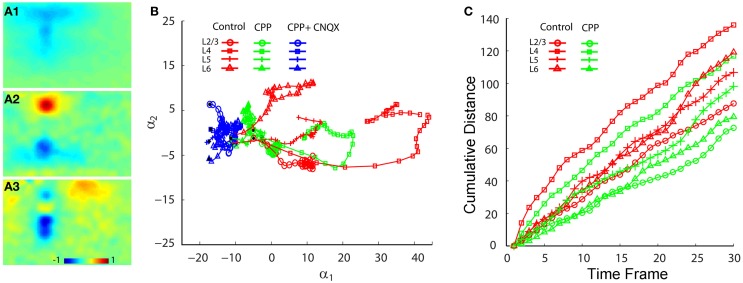
Figure 7.
PCA comparison of projection trajectories of photostimulation-evoked VSD responses in normal ACSF, in the presence of CPP and with the co-application of CPP and CNQX. The PCA are based on the image data sets presented in Figure 6. (A1–A3) Show the first three principal spatial modes (shown as images) derived from the PCA decomposition of the combined VSD image sequence (N = 12 files) from the four stimulation sites (layers 2/3, 4, 5, and 6) in control (normal ACSF), in the presence of CPP and with both CPP and CNQX. The first 30 time frames (66 ms) of the image sequence after photostimulation were used for analysis. (B) Shows the 2D projection of the trajectories of VSD responses, shown in the plane α1 − α2. (C) Shows the cumulative propagation distance of the time varying trajectories of VSD responses (in control and in the presence of CPP) in the 3D phase space (α1, α2, α3).

