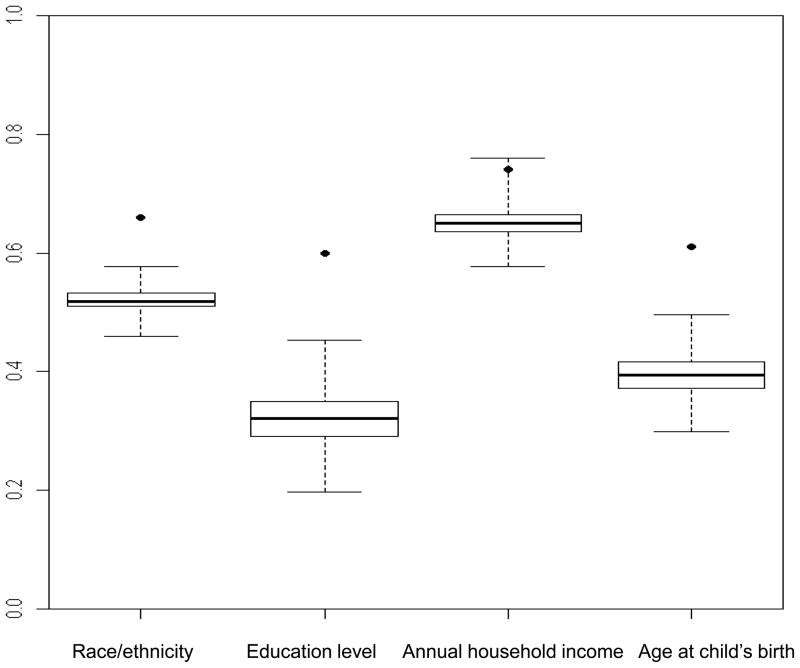
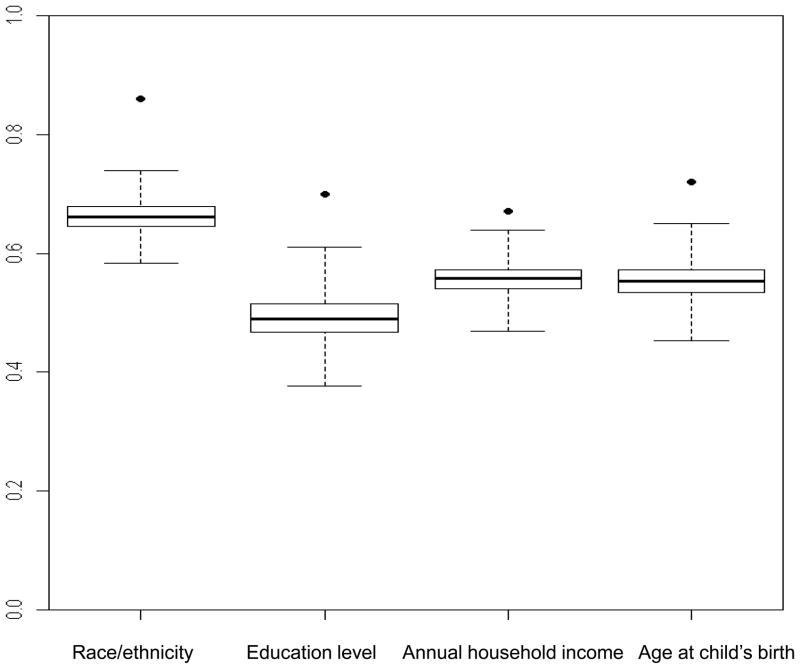
Figure 1. Box-and-whisker plots show distribution of concordance rates from simulated data for cases and friend controls within case-control sets (n=137) for selected demographic characteristics.
Boxes show the median and interquartile range of the concordance rates from simulated data; the vertical extensions indicate the minimum and maximum values. Dots show the observed concordance rate from the case-control study. The demographic characteristics were dichotomized as follows: race/ethnicity (non-Hispanic white, other); education level (<college graduate, ≥college graduate); annual household income (<$35,000, ≥$35,000); age at child’s birth (<30 years, ≥30 years).
A. Perfect concordance rates
From left to right, the concordances from the original data (percentile values) are: 0.66 (100), 0.60 (100), 0.74 (99.8) and 0.61(100). From left to right, the mean concordances from the simulated data are: 0.52, 0.32, 0.65 and 0.40.
B. Proportional concordance rates
From left to right, the concordances from the original data (percentile values) are: 0.86 (100), 0.70 (100), 0.67 (100) and 0.72 (100). From left to right, the mean concordances from the simulated data are: 0.66, 0.49, 0.56 and 0.55.


