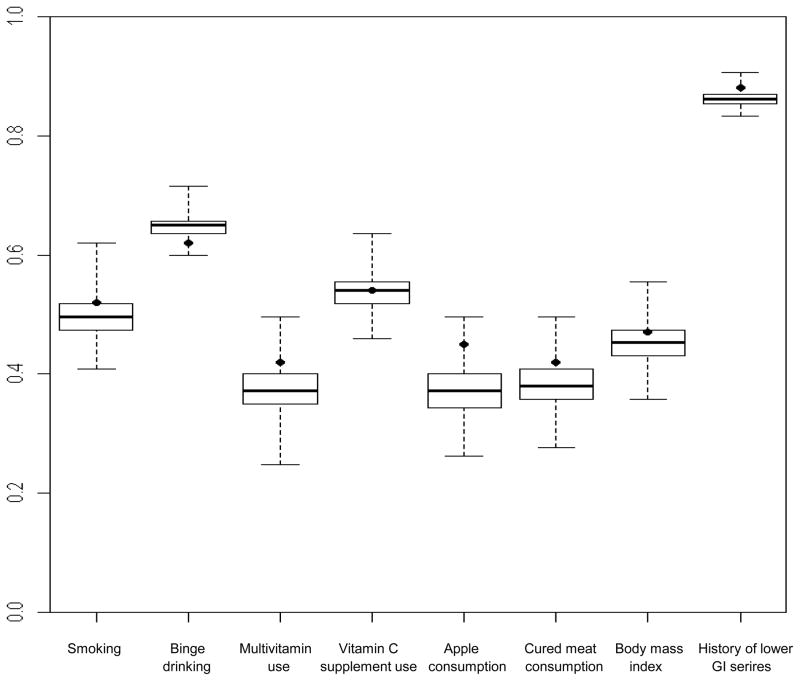
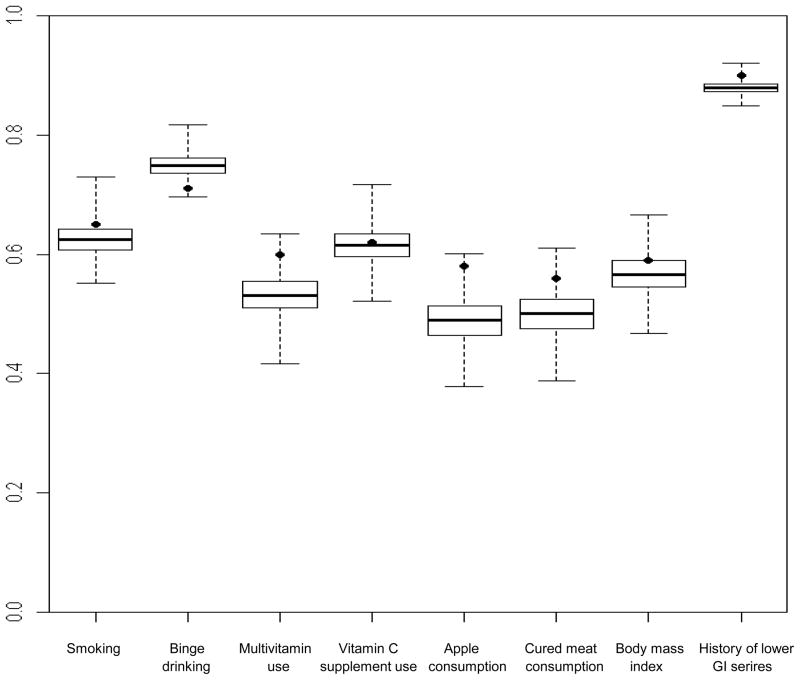
Figure 2. Box-and-whisker plots show distribution of concordance rates from simulated data for cases and friend controls within case-control sets (n=137) for selected exposures.
Boxes show the median and interquartile range of the concordance rates from simulated data; the vertical extensions indicate the minimum and maximum values. Dots show the observed concordance rate from the case-control study. The exposures were dichotomized as follows: smoking (yes, no); binge drinking (<1 time/month, ≥1 time/month); multivitamin use (yes, no); vitamin C supplement use (yes, no); apple consumption (<1/week, ≥1/week); cured meat consumption (≤2 servings/week, >2 servings/week); body mass index (<25, ≥25); history of lower gastrointestinal series (yes, no).
A. Perfect concordance rates
From left to right, the concordances from the original data (percentile values) are: 0.52 (81), 0.62 (6), 0.42 (89), 0.54 (48), 0.45 (97), 0.41(80), 0.47(69) and 0.88 (95). From left to right, the mean concordances from the simulated data are: 0.50, 0.62, 0.37, 0.54, 0.37, 0.38, 0.45 and 0.86.
B. Proportional concordance rates
From left to right, the concordances from the original data (percentile values) are: 0.65 (84), 0.71 (1), 0.60 (98), 0.62 (57), 0.58 (99), 0.56 (95), 0.59 (75) and 0.90 (97). From left to right, the mean concordances from the simulated data are: 0.62, 0.75, 0.53, 0.62, 0.49, 0.50, 0.57 and 0.88.


