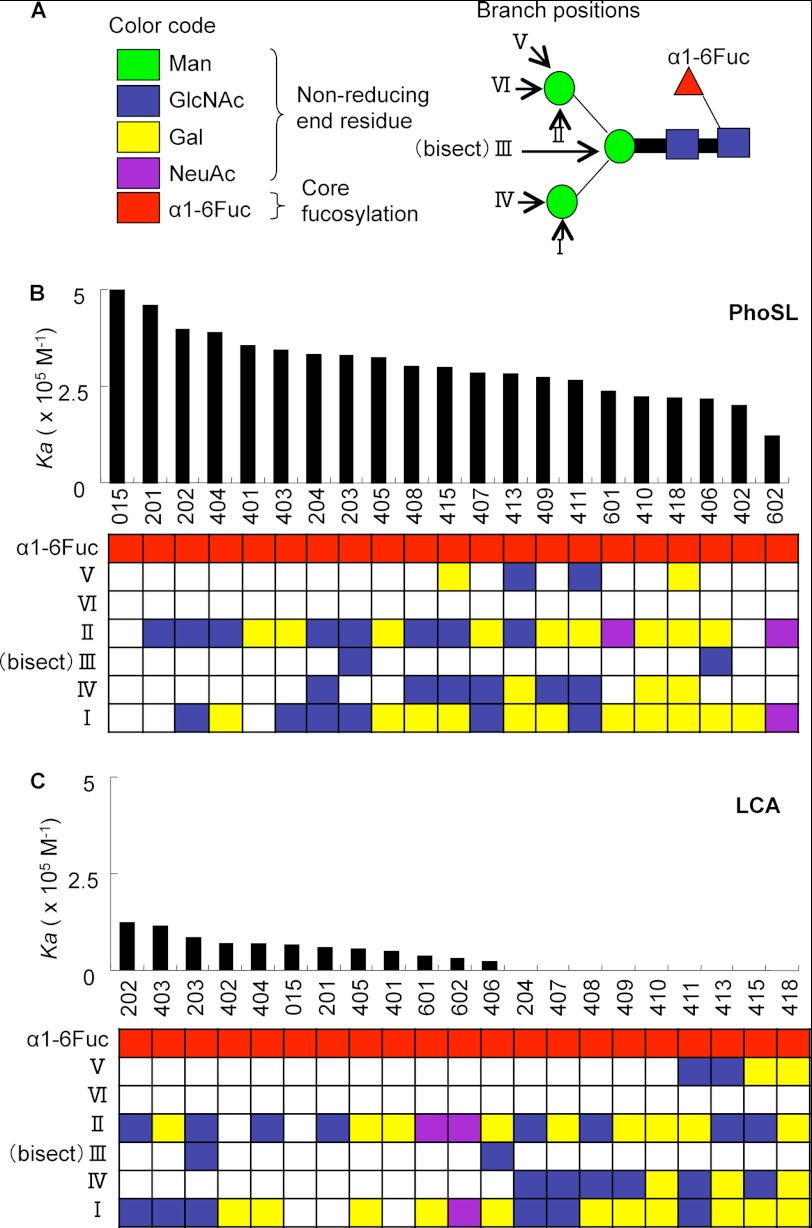
FIGURE 5.
Comparative analysis of glycan binding specificity of PhoSL and LCA by the GRYP code. A, shown are definitions of the GRYP code for representing the branch positions and non-reducing end residues. The non-reducing end sugars and the core fucose are shown in different colors in the left panel. Each branch is numbered from I to VI corresponding to GlcNAc transferases, as shown in the middle panel. B, shown are bar graph representations of the association constants (Ka) of PhoSL toward core-fucosylated N-glycans. Numbers at the bottom of the bar graphs correspond to the sugar numbers indicated in supplemental Fig. S2. C, shown are bar graph representations of the association constants (Ka) of LCA.

