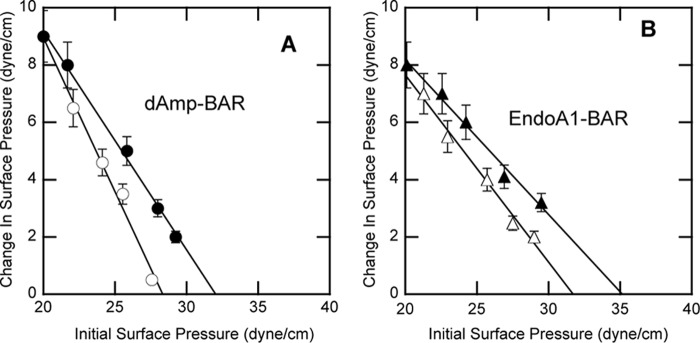
FIGURE 3.
Interactions of dAmp-BAR and EndoA1-BAR with lipid monolayers at the air-water interface. A, dAmp-BAR was allowed to interact with POPC/POPE (80:20) (○) and POPC/POPE/PtdIns(4,5)P2 (77:20:3) (●) monolayers. B, EndoA1-BAR was allowed to interact with POPC/POPE (80:20) (○) and POPC/POPE/PtdIns(4,5)P2 (77:20:3) (●) monolayers. All measurements were performed at 23 °C in 20 mm Tris-HCl buffer, pH 7.4 with 0.16 m KCl. πc was determined by extrapolating the Δπ versus π0 plot to the abscissa. Notice that for both dAmp-BAR and EndoA1-BAR PtdIns(4,5)P2 increases πc above 31 dynes/cm, which is an estimated surface pressure of lipid bilayers, including cell membranes. Error bars indicate standard deviations of triplicate measurements.

