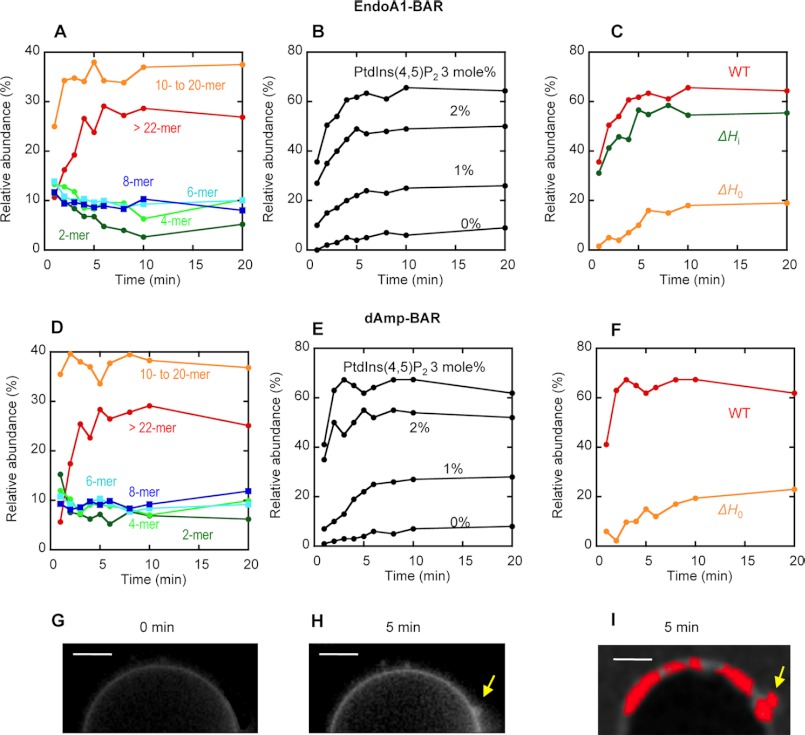
FIGURE 5.
Number and brightness analysis of raster-scanned images of GUV tubulation by N-BAR domains. A, the time course of the relative abundance of different aggregates for EndoA1-BAR bound to POPC/POPS/PtdIns(4,5)P2/Rh-PE (76.5:20:3:0.5) GUVs. B, the time course of the relative abundance of large aggregates (>10-mer) for EndoA1-BAR bound to POPC/POPS/PtdIns(4,5)P2/Rh-PE (79.5 − x:20:x:0.5) GUVs (x = 0–3 mol %). C, the time courses of the relative abundance of large aggregates (>10-mer) for EndoA1-BAR WT, ΔH0, and ΔHi bound to POPC/POPS/PtdIns(4,5)P2/Rh-PE (76.5:20:3:0.5) GUVs. D, the time course of the relative abundance of different aggregates for dAmp-BAR bound to POPC/POPS/PtdIns(4,5)P2/Rh-PE (76.5:20:3:0.5) GUVs. E, the time course of the relative abundance of large aggregates (>10-mer) for dAmp-BAR bound to POPC/POPS/PtdIns(4,5)P2/Rh-PE (79.5 − x:20:x:0.5) GUVs (x = 0–3 mol %). F, the time courses of the relative abundance of large aggregates (>10-mer) for dAmp-BAR WT and ΔH0 bound to POPC/POPS/PtdIns(4,5)P2/Rh-PE (76.5:20:3:0.5) GUVs. G and H, a representative image of POPC/POPS/PtdIns(4,5)P2/Rh-PE GUV (76.5:20:3:0.5) shown by Rh-PE fluorescence before (G) and after (H) 5-min treatment with EndoA1-BAR WT. I, distribution of EndoA1-BAR aggregates (>10-mers; shown in red) was superimposed onto the image of GUV after 5-min treatment. Notice that >10-mers are enriched in the deformed vesicle surface (yellow arrows). All measurements were performed at 37 °C in 20 mm Tris-HCl buffer, pH 7.4 with 0.16 m KCl. Protein concentration was 0.5 μm. White bars indicate 5 μm.

