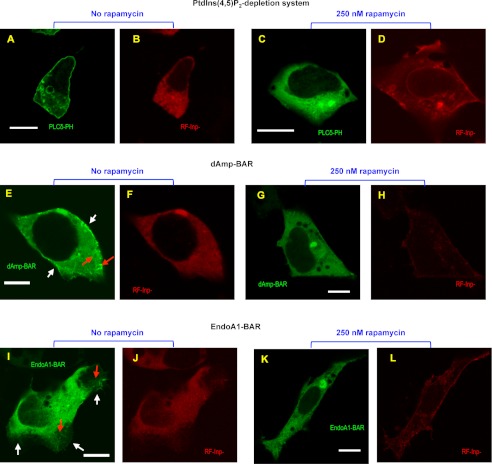
FIGURE 6.
Effects of PtdIns(4,5)P2 depletion on the cellular membrane deforming activity of dAmp-BAR and EndoA1-BAR. A–D, confocal images of representative HEK293 cells co-expressing EGFP-tagged PLCδ PH domain (PLCδ-PH), PM-FRB, and RF-Inp before and after rapamycin stimulation. Before rapamycin treatment, PLCδ-PH (A) and RF-Inp (B) are localized in the plasma membrane and the cytosol, respectively. 10 min after treatment with 250 nm rapamycin, PLCδ PH-EFGP is depleted from the plasma membrane (C), whereas a significant portion of RF-Inp is localized in the plasma membrane (D). E–H, confocal images of representative HEK293 cells overexpressing C-terminal EGFP-tagged dAmp-BAR, PM-FRB, and RF-Inp before and after rapamycin stimulation. Before rapamycin treatment, dAmp-BAR (E) causes extensive membrane tubulation (red arrow) and shows some degree of plasma membrane localization (white arrows), whereas RF-Inp (F) is dispersed in the cytosol. 10 min after treatment with 250 nm rapamycin, all tubules disappeared, and dAmp-BAR showed diffuse cytosolic distribution (G), whereas RF-Inp (H) is seen at the plasma membrane. I–L, confocal images of representative HEK293 cells overexpressing C-terminal EGFP-tagged EndoA1-BAR, PM-FRB, and RF-Inp before and after rapamycin stimulation. I, before rapamycin stimulation, EndoA1-BAR causes a lesser degree of tubulation (red arrow) and more extensive lamellipodium formation. In lamellipodia, EndoA1-BAR shows strong plasma membrane localization (white arrows). J, RF-Inp is dispersed in the cytosol before rapamycin treatment. 10 min after treatment with 250 nm rapamycin, all tubules and lamellipodia disappeared, and EndoA1-BAR showed diffuse cytosolic distribution. L, the red channel image of the same cell as in K demonstrating the sustained plasma membrane localization of RF-Inp. All images were taken after fixation with 4% paraformaldehyde. For both N-BAR domains, similar patterns were observed for >70% of 30 cells examined. White bars indicate 10 μm.

