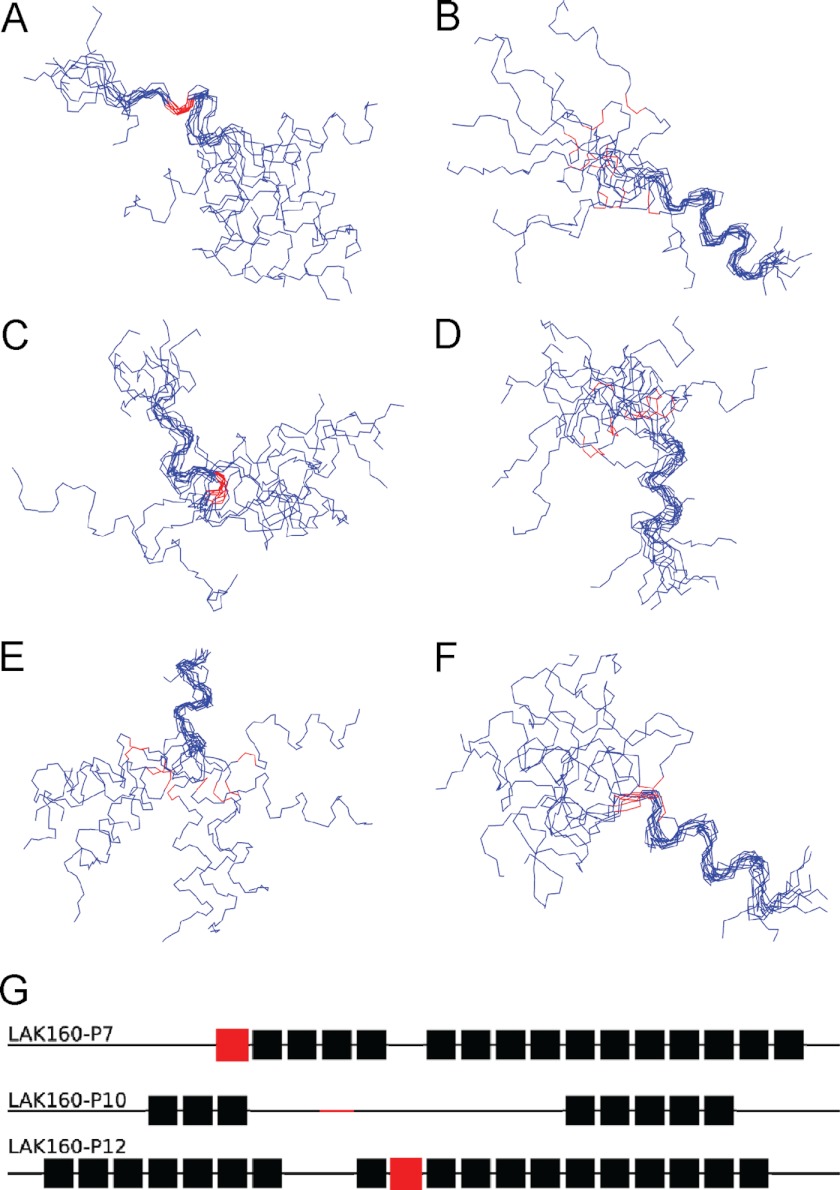
FIGURE 4.
Shown is the superimposition of backbone atoms in each of the 10 lowest energy structures for LAK160-P7 (A and B), LAK160-P10 (C and D), and LAK160-P12 (E and F) fitted to either region 1 (A, C, and E) or region 2 (B, D, and F). Proline residues are shown in red. Also shown is a schematic representation of the 10 lowest energy structures where residues that are α-helical in more than eight structures are shown as solid boxes, and those that are α-helical in seven or fewer structures are shown as a line (G). Proline residues are again marked in red.

