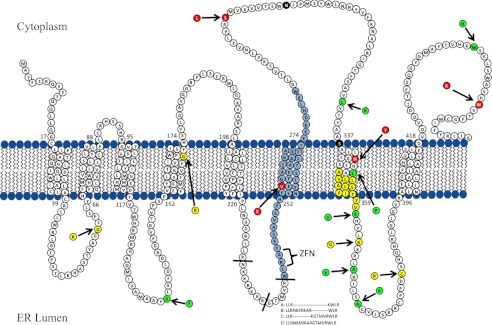
FIGURE 4.
Schematic representation of PORCN structure and topology model. FDH mutations studied in this report are highlighted in yellow, red, and green, whereas the highly conserved residues Asn-306 and Ser-337 are highlighted in white on black. Splice variants resulting from selective inclusion of exons 7 and 8 are indicated by lines between amino acids, and resulting different protein sequences are shown below. Exon 9 is highlighted in light blue, with the ZFN binding site indicated. Colored amino acid residues indicate mutations associated with FDH. Colors indicate classification: low protein expression (yellow), loss of activity and near normal expression (red), and normal activity and expression at higher transfection levels (green). The N terminus is at the left, and the predicted ER lumenal side is below. Only missense mutations are indicated here. We have borrowed heavily from a previous publication in constructing this model (44).

