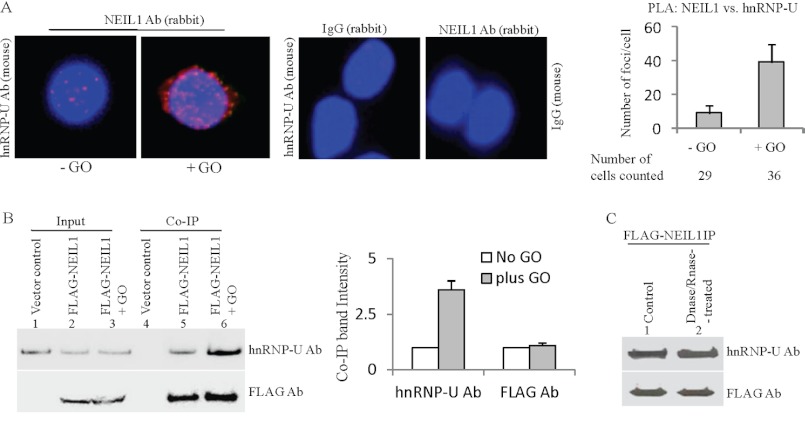
FIGURE 1.
In-cell association of NEIL1 with hnRNP-U and its enhancement after oxidative stress. A, in situ PLA analysis (Duolink) for association of endogenous NEIL1 with hnRNP-U in HEK293 cells (left panel), indicated by red foci in nuclei (stained blue with DAPI). The association increased significantly in cells treated with GO (50 ng/ml for 30 min; right panel). Right column, PLA controls with NEIL1 Ab (rabbit) versus IgG (mouse) or hnRNP-U Ab (mouse) versus IgG (rabbit). Histogram (right) represents quantitation of PLA foci/cell for NEIL1 versus hnRNP-U in untreated versus GO-treated cells. B, co-IP analysis of hnRNP-U with FLAG-NEIL1 in extracts from stably FLAG-NEIL1-expressing HEK293 cells. Increased association in oxidatively stressed cells is similar to A. IPs of extracts from cells stably expressing empty vector as the control are shown. The Western blot band intensity was quantified and represented as histogram. Error bars indicate S.D. C, association between FLAG-NEIL1 and hnRNP-U unaffected by treatment of HEK293 cell extracts with DNase I/RNase A (500 units/ml each).

