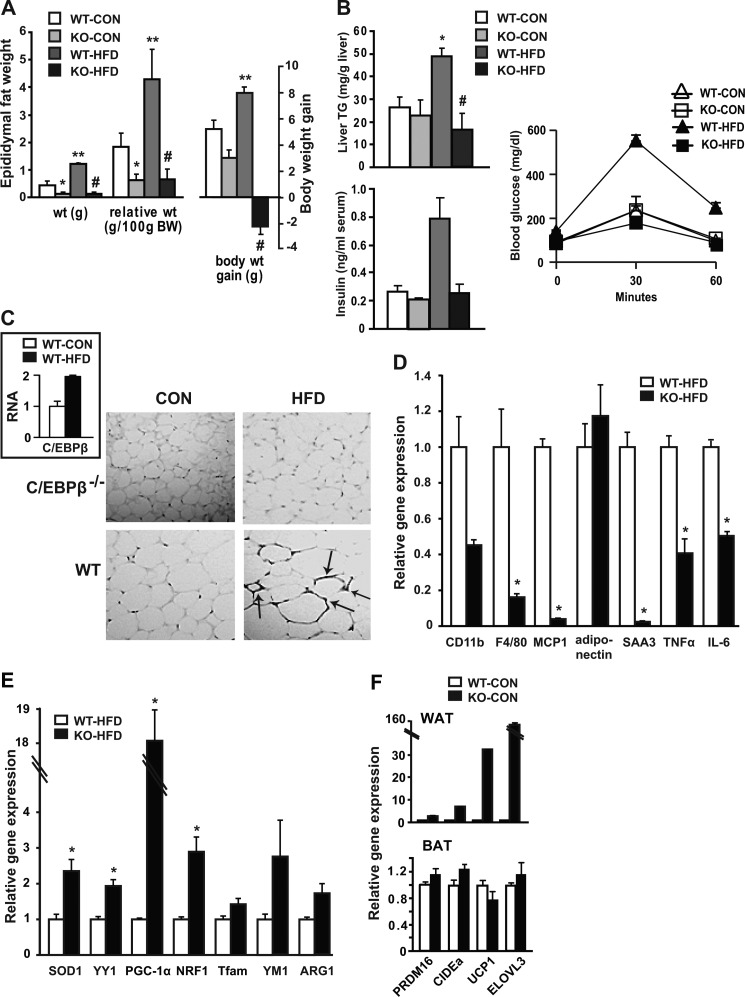
FIGURE 1.
Resistance to weight gain, reduced adipose tissue inflammation, and BAT gene expression in WAT of C/EBPβ−/− mice. A, epididymal adipose tissue weight and relative weight change, and body weight gain of WT and C/EBPβ−/− mice fed CON or HFD for 16 weeks. Data are shown as mean ± S.E. *, p < 0.05 versus WT-CON; **, p < 0.05 versus WT-CON; #, p < 0.05 versus WT-HFD; n = 4 mice/group. B, hepatic TG levels and fasting insulin levels measured by ELISA. *, p < 0.05 versus WT-CON; #, p < 0.05 versus WT-HFD; n = 4 mice/group. C, representative sections of WAT immunostained with macrophage marker F4/80. Arrows point to crown-like rump structures within cells from WT mice on HFD. Images were taken at ×200 magnification. Inset: C/EBPβ expression measured by qPCR in WAT from WT mice fed CON or HFD. D–E, macrophage marker and inflammatory gene (D) and mitochondrial gene (E) expression was measured in epididymal WAT by qPCR from WT and C/EBPβ−/− mice fed HFD. Data are shown as mean ± S.E. *, p < 0.05; n = 4 mice/group. F, relative gene expression in WAT and BAT for BAT marker genes in CON-fed WT and C/EBPβ−/− mice analyzed by qPCR. Data are shown as mean ± S.E. n = 4 mice/group.

