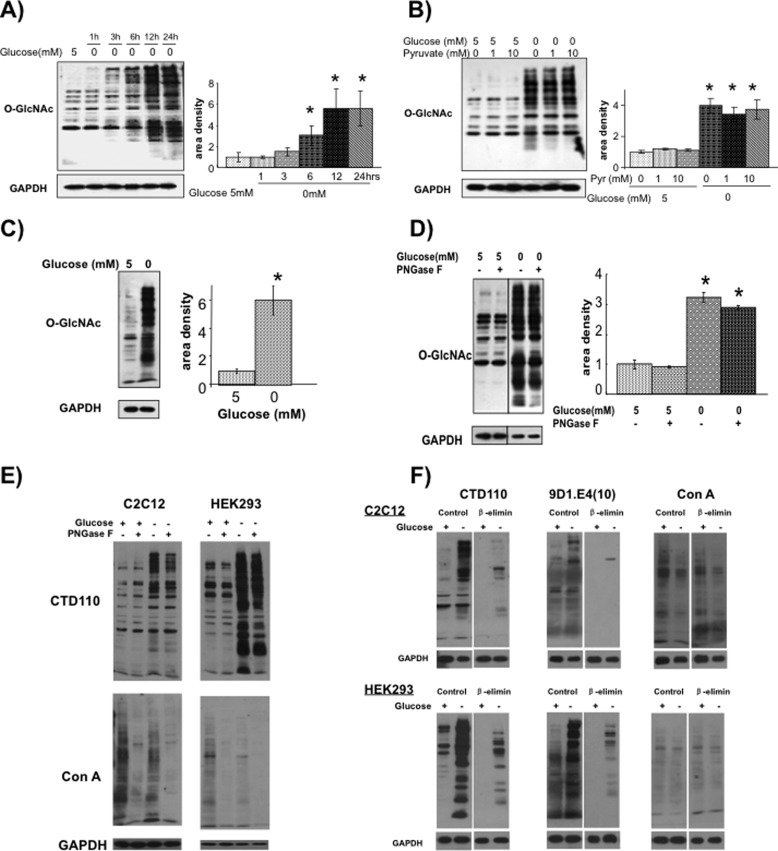
FIGURE 1.
A, changes in O-GlcNAc levels in NRVMs following glucose deprivation for 1–24 h. Left, O-GlcNAc immunoblots, using CTD110.6 antibody. Right, protein area density (n = 4). *, p < 0.05 versus 5 mm glucose. Error bars, S.E. B, effect of pyruvate on O-GlcNAc levels with and without glucose for 6 h. Left, O-GlcNAc immunoblots, using CTD110.6 antibody. Right, protein area density (n = 3). *, p < 0.05 versus 5 mm glucose. C, changes in O-GlcNAc levels in NRVMs following glucose deprivation for 24 h determined using the anti-O-GlcNAc antibody clone 9D1.E4(10) from Millipore. *, p < 0.05 versus control. D, effects of PNGase treatment on O-GlcNAc levels of C2C12 myocytes using CTD110.6 antibody following 24 h of glucose deprivation (n = 3). *, p < 0.05 versus control. E, effects of PNGase F on O-GlcNAc (CTD110) and N-glycan (ConA) levels in C2C12 and HEK293 cells under normal euglycemic conditions and following glucose deprivation. F, effects of in-blot β-elimination on reactivity of O-GlcNAc antibodies CTD110.6 and 9D1.E4(10) and ConA levels in C2C12 and HEK293 cells under normal euglycemic conditions and following glucose deprivation.

