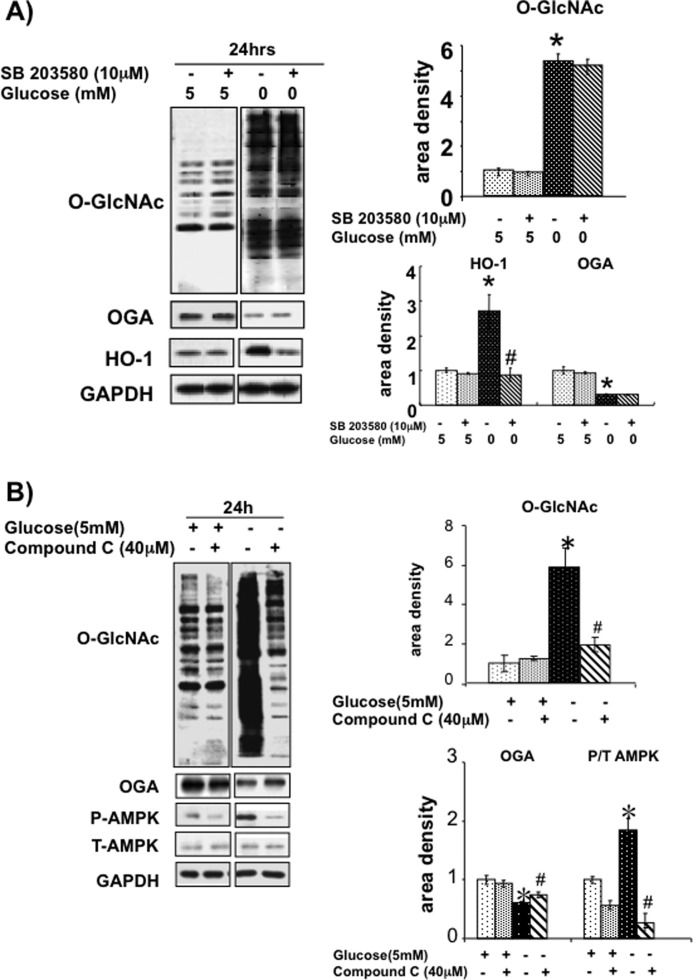
FIGURE 5.
A, effect of p38 MAPK inhibitor SB203580 on O-GlcNAc, OGA, and HO-1 protein levels. n = 4. *, p < 0.05 versus 5 mm glucose. #, p < 0.05 versus SB203580. Error bars, S.E. B, effects of AMPK inhibitor, Compound C (40 μm), on O-GlcNAc, OGA, phospho-AMPK, and total AMPK levels. Left, immunoblots. n = 4. *, p < 0.05 versus 5 mm glucose. #, p < 0.05 versus Compound C.

