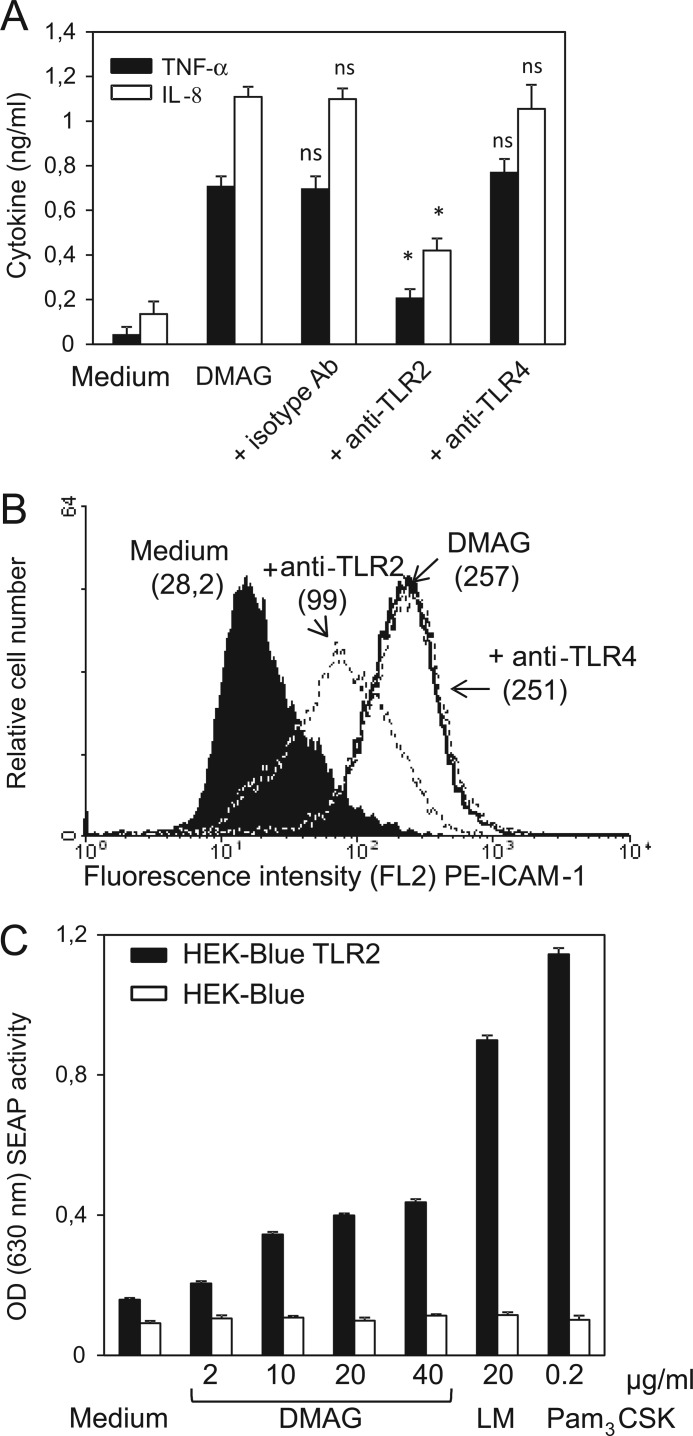
FIGURE 5.
TLR2-dependent activity of Mma_DMAG. Differentiated THP-1 cells were pretreated with 15 μg/ml concentrations of either anti-TLR2, anti-TLR4, or control isotype monoclonal antibodies (Ab) for 30 min at 37 °C in 2% FCS-RPMI 1640 medium before the addition of 20 μg/ml Mma_DMAG. A, supernatants were collected after 6 or 24 h and assayed by ELISA for both TNF-α and IL-8 productions. Values represent the means ± S.D. of triplicates. Statistical analyses were performed using Student's t test. Asterisks indicate values of p < 0.02; ns, nonspecific p > 0.05. B, cell surface expression of ICAM-1 was determined by flow cytometry after stimulation of differentiated THP-1 cells for 24 h. The shown data are representative of at least of three independent experiments. C, stimulation of HEK-Blue-hTLR2 cell line by Mma_DMAG is shown. The HEK-Blue-hTLR2 and HEK-blue-Null1 (control) cell lines were stimulated with various Mma_DMAG concentrations. Lipopeptide Pam3CSK4 (200 ng/ml) and LM (20 μg/ml) were also included as TLR2 agonists. Cell activation was determined after 20 h of incubation by measuring SEAP activity at OD630 using the QUANTI-Blue detection assay. Results are expressed as means ± S.D. of triplicates and are representative of three independent experiments. Statistical significance between Mma_DMAG-treated and unstimulated HEK-Blue-hTLR2 cells was determined using Student's t test (p values were <0.03).

