
FIGURE 3.
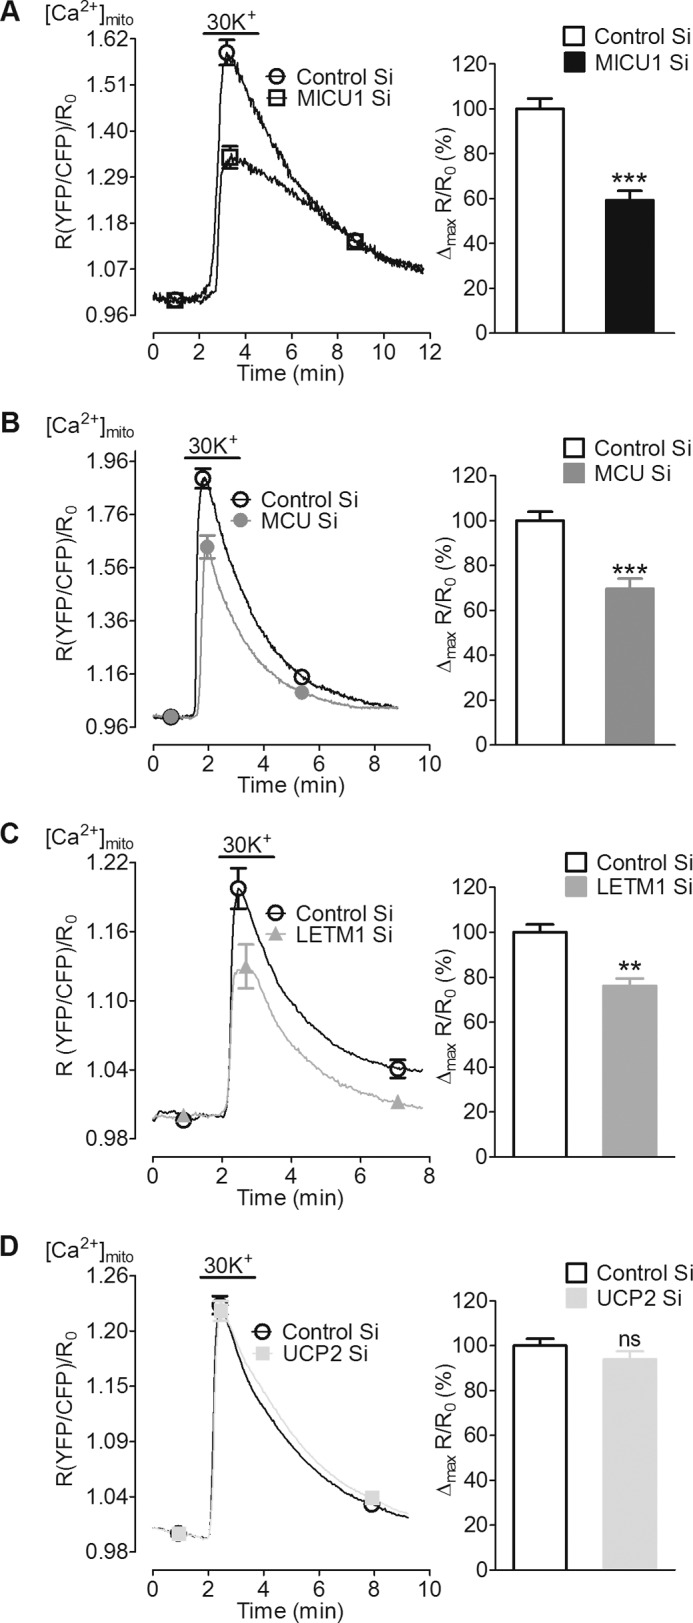
Knockdown of MICU1, MCU, and LETM1 reduced mitochondrial Ca2+ uptake of entering Ca2+ upon plasma membrane depolarization with 30 mm KCl. INS-1 832/13 cells transiently co-transfected with 4mtD3cpv (mito-cameleon) and respective siRNAs were used 48 or 72 h after transfection. A–D, left panels, average curves show a fast and transient rise in [Ca2+]mito upon depolarization of cells with 30 mm KCl in the presence of extracellular Ca2+. Curves represent a ratio of YFP/CFP over time after correction for background and photobleaching. Right panels, peak [Ca2+]mito amplitudes were calculated from individual curves and are represented as the percentage of control. A–C, silencing of MICU1 (n = 9), MCU (n = 9), and LETM1 (n = 12) significantly reduced [Ca2+]mito. D, UCP2 suppression did not influence [Ca2+]mito (n = 11).***, p < 0.001, **, p = 0.011 versus respective control. Control Si, control siRNA. ns, not significant.