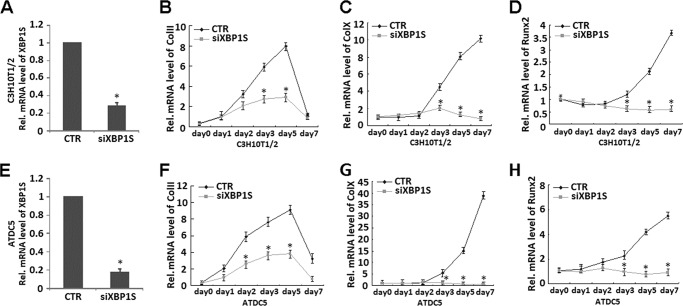
FIGURE 7.
Knockdown of XBP1S using the siRNA approach largely abolishes chondrocyte hypertrophy, as revealed by collagen II, collagen X, and RUNX2 expression. A and E, siRNA against XBP1S mRNA efficiently inhibited expression of endogenous XBP1S in both C3H10T1/2 (A) and ATDC5 cells (E). Cells were infected with either Ad-XBP1S siRNA or control adenovirus (CTR), and total RNA was collected for real-time PCR. Expression of XBP1S was normalized against the GAPDH endogenous control. The normalized values were then calibrated against the control value, here set as 1. *, p < 0.05. B and F, repression of XBP1S totally abolished BMP2-induced collagen II expression in C3H10T1/2 (B) and ATDC5 (F) cells. Transcript levels of collagen II were detected by real-time PCR analysis of RNA isolated from micromass cultures of C3H10T1/2 (B) or ATDC5 (F) cells infected with siXBP1S or control adenovirus in the presence of 300 ng/ml BMP2 at various time points, as indicated. *, p < 0.05. C and G, repression of XBP1S totally abolished BMP2-induced collagen X expression in C3H10T1/2 (C) and ATDC5 (G) cells. Transcript levels of collagen X were detected by real-time PCR analysis of RNA isolated from micromass cultures of C3H10T1/2 (C) or ATDC5 (G) cells infected with siXBP1S or control adenovirus in the presence of 300 ng/ml of BMP2 at various time points, as indicated. *, p < 0.05. D and H, repression of XBP1S largely abolished BMP2-induced RUNX2 expression in C3H10T1/2 (D) and ATDC5 (H) cells. Transcript levels of RUNX2 were detected by real-time PCR analysis of RNA isolated from micromass cultures of C3H10T1/2 (D) or ATDC5 (H) cells infected with siXBP1S or control adenovirus in the presence of 300 ng/ml BMP2 at various time points, as indicated. *, p < 0.05. Error bars, S.D.

