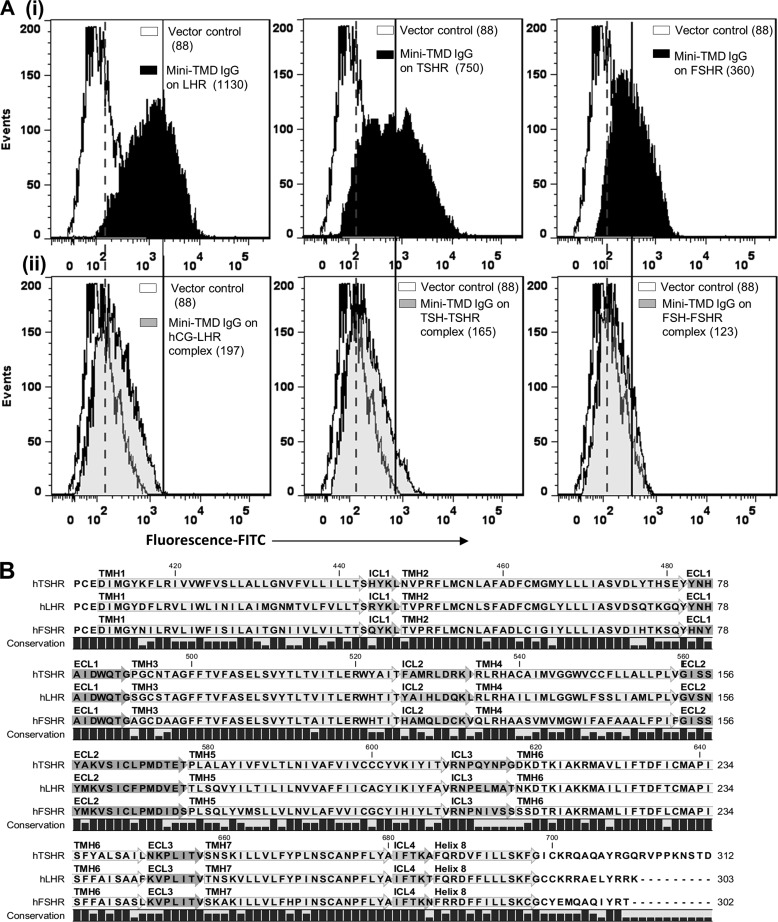
FIGURE 4.
Binding of the mini-TMD antibodies to receptor and hormone-receptor complex. Ai, shown is a flow cytometric analysis of binding of the mini-TMD antibodies (20 μg/ml) to HEK293 cells expressing LHR (left panel), TSHR (middle panel,) or FSHR (right panel). Aii, HEK293 cells expressing the LHR (left panel), TSHR (middle panel), or FSHR (right panel) were previously saturated with their respective hormones (10 nm), and binding of the mini TMD antibodies (20 μg/ml) was monitored by flow cytometry (gray histograms). In both Fig. Ai and Aii, the white histograms indicate binding of the mini-TMD antibodies to the mock-transfected HEK293 cells. The broken and unbroken lines designate the median fluorescence intensity of the gray histograms and black histograms, respectively, measured in the same experiment. B, multiple sequence alignment of the transmembrane domains of the three glycoprotein hormone receptors is shown.

