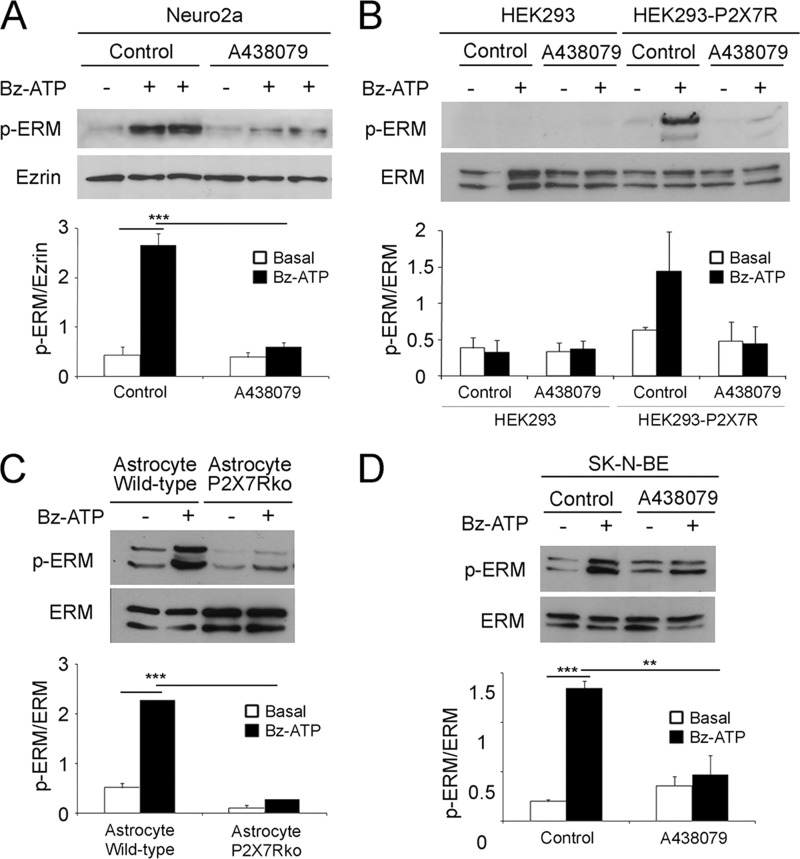
FIGURE 1.
ERM activation is specifically induced by P2X7R stimulation. A, Neuro2a cells were pretreated with or without a pharmacological inhibitor of P2X7R (A438079) at 37 °C for 1 h and stimulated or not with 1 mm Bz-ATP for 10 min. Proteins from whole cell lysates of Neuro2a cells stimulated or not with 1 mm Bz-ATP were separated by SDS-PAGE. After transfer, the nitrocellulose membrane was probed with anti-phosphospecific ERM Abs (upper panel). The blot was stripped and probed with anti-ezrin Ab (lower panel). Blots were scanned, and the ratios of phosphorylated ERM (p-ERM) to total ezrin are presented as histograms. The graph shows the ratios of the phosphorylated ERM versus the total ezrin. Data are from four independent experiments (one-way ANOVA followed by Tukey's test, F = 35.73). B, HEK cells or mouse P2X7R stable transfectants of HEK cells were treated as in A. Cell lysates were analyzed by Western blot with anti-phosphospecific ERM (upper blot) or anti-ERM antibodies (lower blot). The graph shows the ratios of the phosphorylated ERM versus the total ERM. Data are from three independent experiments (one-way ANOVA followed by Tukey's test, F = 4.18). C, astrocytes from wild-type and P2X7R KO animals were treated or not with 1 mm Bz-ATP at 37 °C for 10 min. Whole cell lysates were analyzed by Western blot with anti-phosphospecific ERM Abs (upper blot) and by anti-ERM Abs (lower blot). Blots were scanned, and the ratios of phosphorylated ERM versus the total ERM are shown as histograms. Data are from three independent experiments (one-way ANOVA followed by Tukey's test, F = 33.95). D, the human neuroblastoma SK-N-BE cells were pretreated with or without A438079 at 37 °C for 1 h and stimulated with or without 1 mm Bz-ATP for 10 min. Whole cell lysates were prepared and analyzed by Western blot using anti-phosphospecific ERM (upper blot) or anti-ERM Abs (lower blot). Blots were scanned, and the ratios of phosphorylated ERM versus the total ERM are shown as histograms. Data are from three independent experiments (one-way ANOVA followed by Tukey's test, F = 23.73; *, p < 0.05; **, p < 0.01; ***, p < 0.001). Error bars represent S.E.

