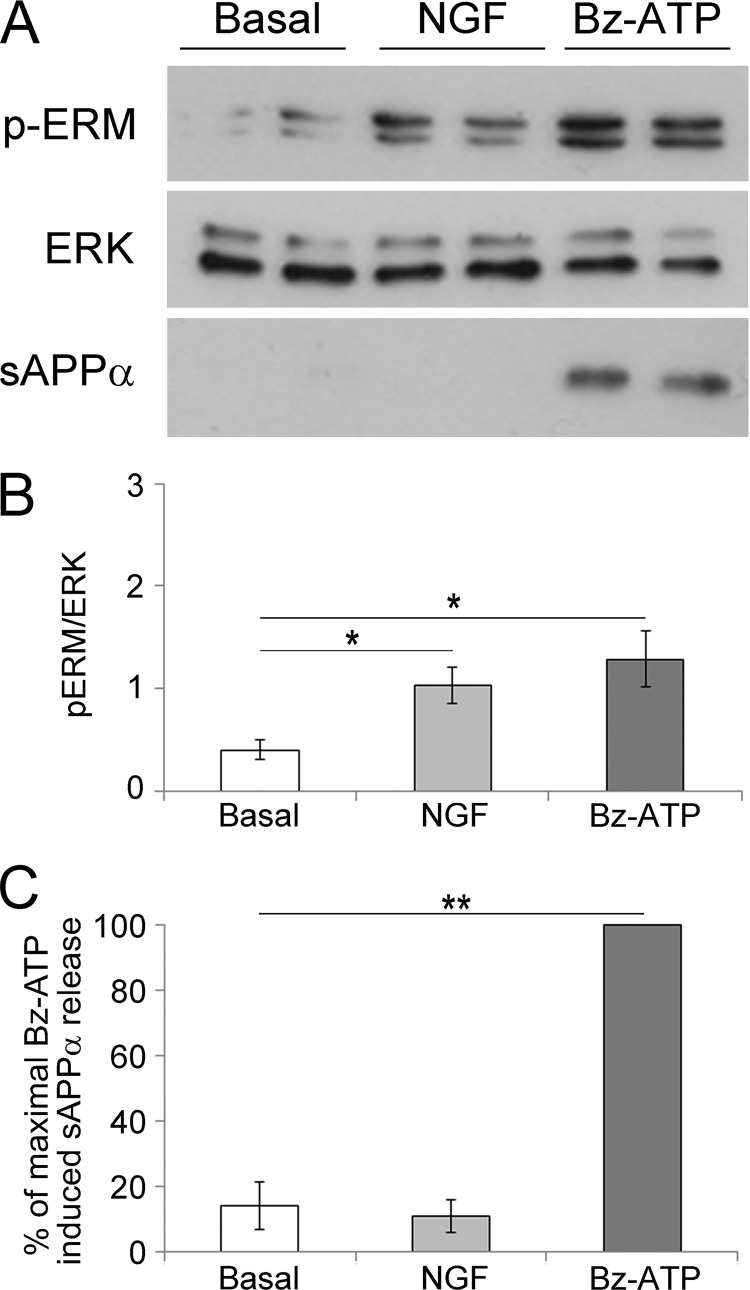
FIGURE 6.
NGF stimulation induces ERM phosphorylation but not sAPPα release. A, Neuro2a cells were stimulated or not with 100 ng/ml NGF or 1 mm Bz-ATP for 15 min. Proteins from whole cell lysates of Neuro2a cells were separated by SDS-PAGE. After transfer, the nitrocellulose membrane was probed with anti-phosphospecific ERM Abs (upper panel). The blot was stripped and probed with anti-ERK Abs (middle panel). The supernatants of Neuro2a cells were analyzed for sAPPα shedding by Western blot (lower panel). B, blots were scanned, and the ratios of phosphorylated ERM by ERK are presented as histograms. The graph shows the ratios of the phosphorylated ERM (pERM) versus ERK. Data are from four independent experiments (Student's t test; *, p < 0.05). C, the amount of sAPPα released was quantified by densitometric analysis. The percentage of sAPPα shed by Neuro2a cells stimulated or not with NGF or Bz-ATP corresponds to the quantity of sAPPα shed divided by the amount of sAPPα released by Bz-ATP-stimulated cells × 100. Data are from three independent experiments (Student's t test; **, p < 0.01). Error bars represent S.E.

