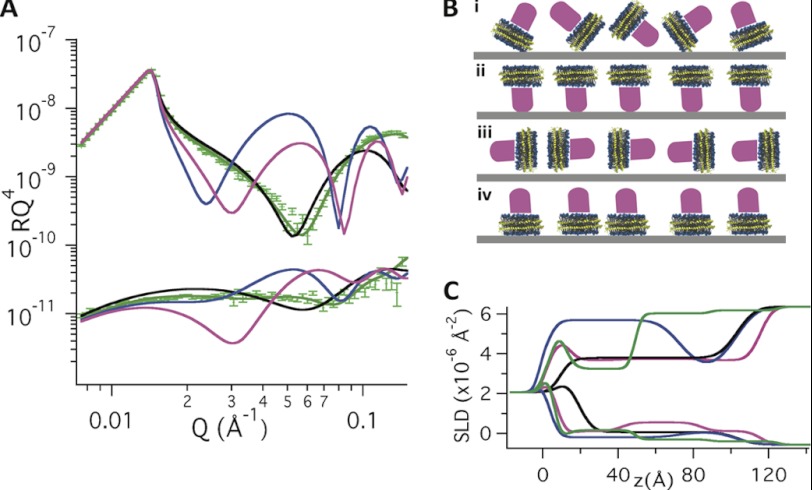
FIGURE 2.
A, neutron reflectivity data of POR nanodiscs (green markers) and simulated reflectivity curves (lines) of the POR nanodiscs adsorbed to the silica-liquid interface in D2O (upper data sets) and H2O (lower data sets). The simulated reflectivity curves in A represent nanodiscs adsorbed in the different orientations schematically shown in B: (i) without any particular orientation represented by a single homogenous layer with scattering length density resulting from the weighted average of DMPC, MSP1D1, and POR (black). This model fails to represent the experimental data and the film must therefore possess an ordered structure. A variety of possible orientations were then envisioned: (ii) strong POR-silica interactions, which cause the protein to face the surface (blue), (iii) or POR nanodiscs aligned perpendicular to the interface (pink), and (iv) POR nanodiscs aligned at the interface in the same manner as empty nanodiscs, with the lipid bilayer parallel to the interface and with the water soluble part of the POR protein facing the aqueous bulk solution (green). The POR was modeled as a cylinder with constant volume, whereas the height (protrusion from the bilayer) was allowed to vary.

