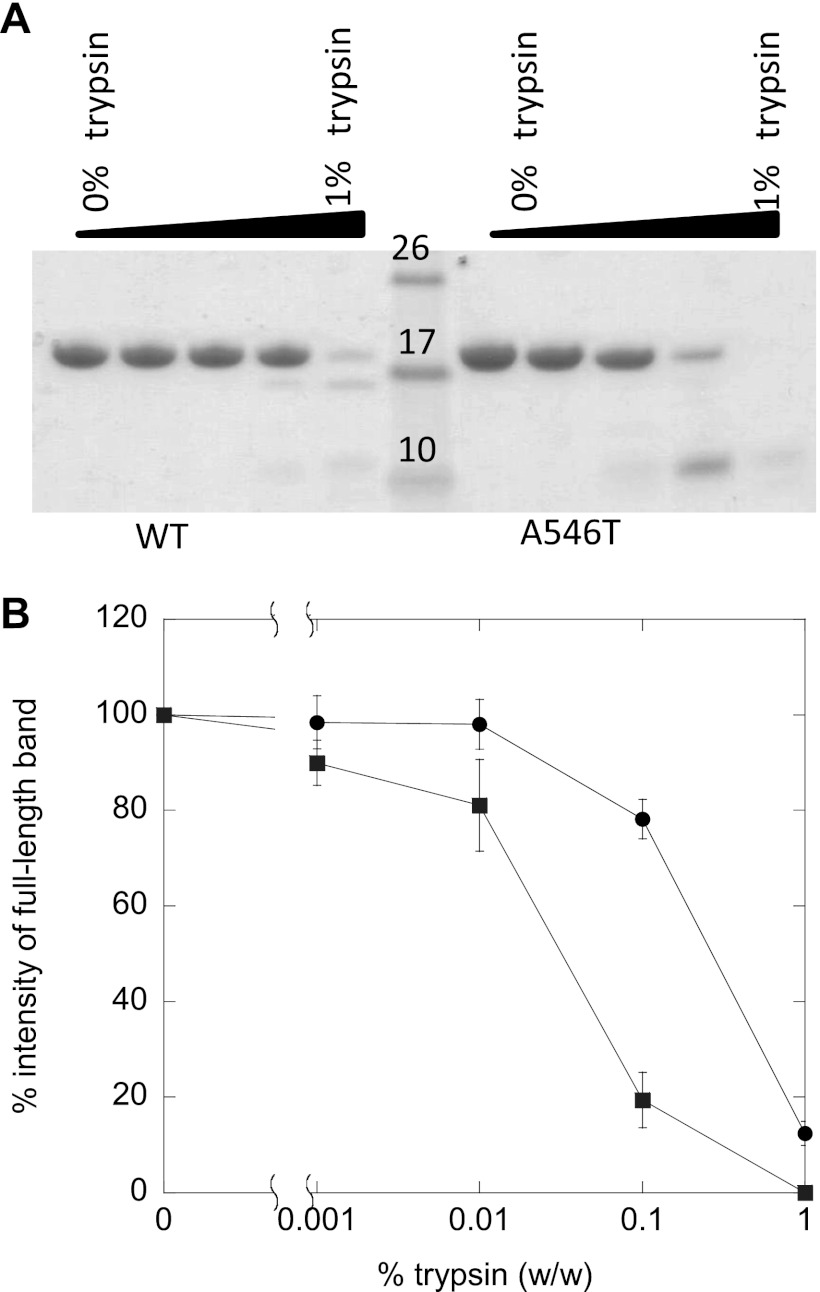
FIGURE 2.
Trypsin digestion of FAS1–4 WT and FAS1–4 A546T. A, shown is a SDS-PAGE gel of FAS1–4 WT and FAS1–4 A546T incubated with 1, 0.1, 0.01, 0.001, and 0% of trypsin (w/w). B, shown are the relative intensities of the band on SDS-PAGE after trypsin digestion of FAS1–4 A546T (■) and FAS1–4 WT (○). The intensities of the band on the SDS-PAGE gel were determined using the software ImageJ (National Institutes of Health).

