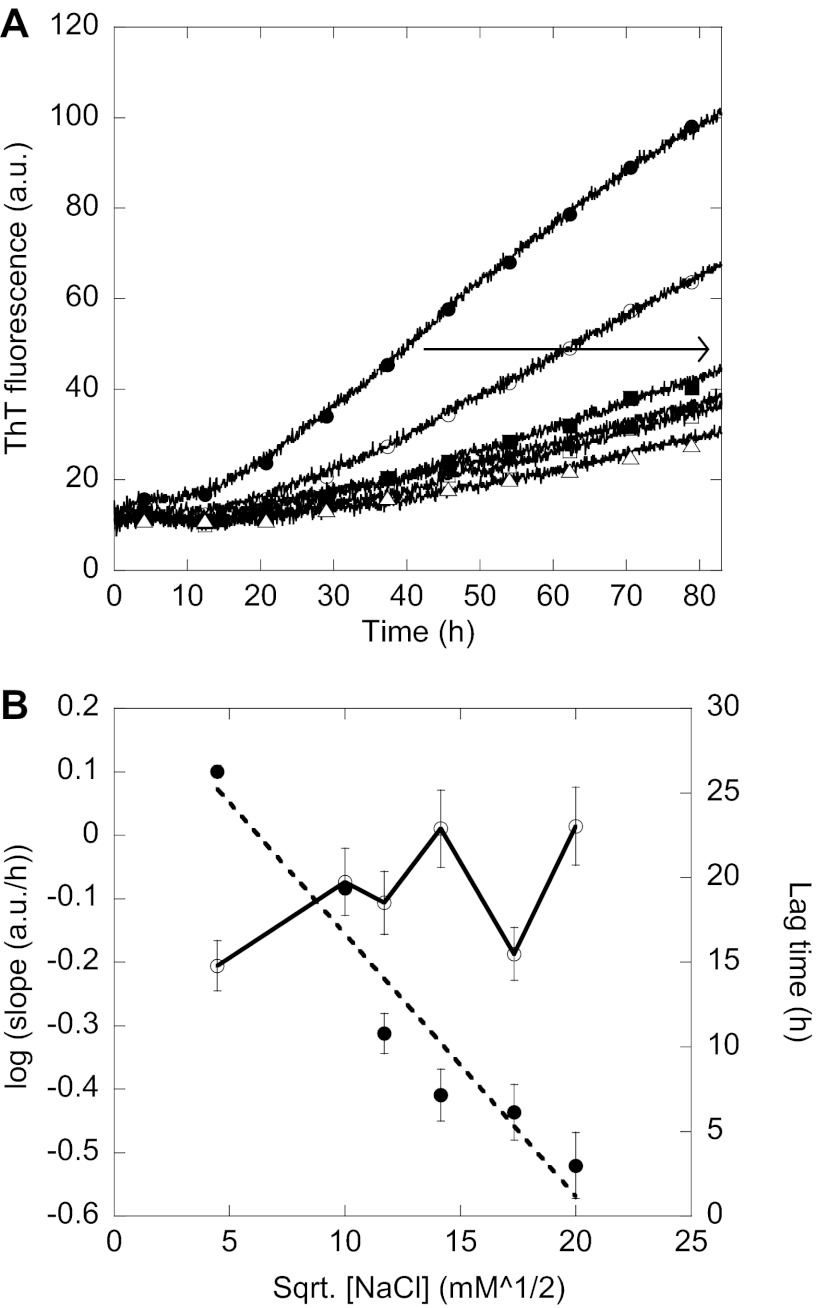
FIGURE 4.
Electrostatic screening of fibrillation. A, ThT fluorescence of 0.8 mg/ml FAS1–4 A546T with 20 mm (●), 100 mm (○), 137 mm (■), 200 mm (□), 300 mm (▴), and 400 mm (△) NaCl. The arrow indicates increasing NaCl concentration. B, left y axis, the logarithm of the slope of the elongation phase of the ThT curve seen during fibrillation is plotted against the square root of the NaCl concentration in mm for 0.8 mg/ml FAS1–4 A546T and gives a straight line (●). Right y axis, shown is the lag time of the fibrillation curves in A plotted against the square root of the NaCl concentration (○). The lag time is determined as the intersection between the two straight lines formed during the lag phase and the elongation phase respectively. a.u., arbitrary units.

