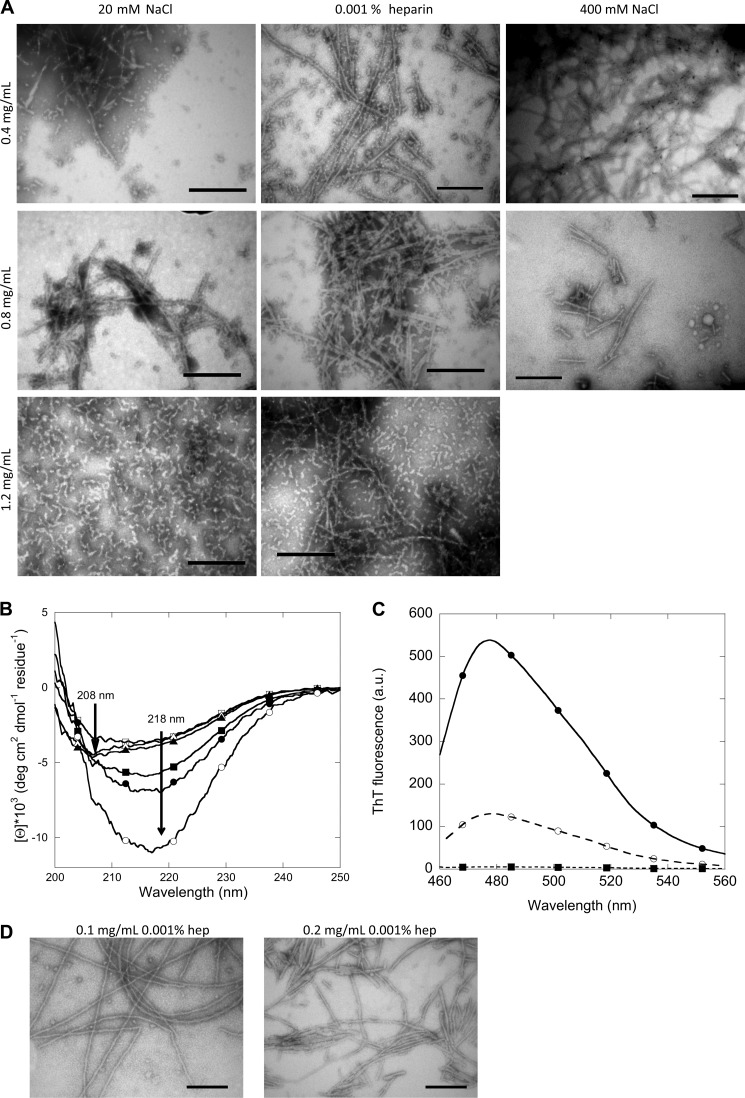
FIGURE 6.
Structural analysis of fibrils formed at different concentrations with 20 mm NaCl, 400 mm NaCl, or 0.001% heparin. A, shown is TEM analysis of the morphology of fibrils of FAS1–4 A546T at 0.4, 0.8, and 1.2 mg/ml with 20 mm NaCl, 400 mm NaCl, or 0.001% heparin. B, shown are CD spectra of the secondary structure of fibrils of FAS1–4 A546T at 0.4 (circles), 0.8 (squares), and 1.2 mg/ml (triangles) with 20 mm NaCl (open symbols) or 0.001% heparin (closed symbols). C, shown are ThT fluorescence spectra of the two types of fibrils normalized to protein concentration, long and straight fibrils at 0.4 mg/ml 0.001% heparin (●) and short and curly fibrils at 1.2 m/ml 20 mm NaCl (○), and ThT in buffer (■). D, TEM analysis of the morphology of fibrils of FAS1–4 A546T at 0.1 and 0.2 mg/ml with 0.001% heparin is shown. a.u., arbitrary units.

