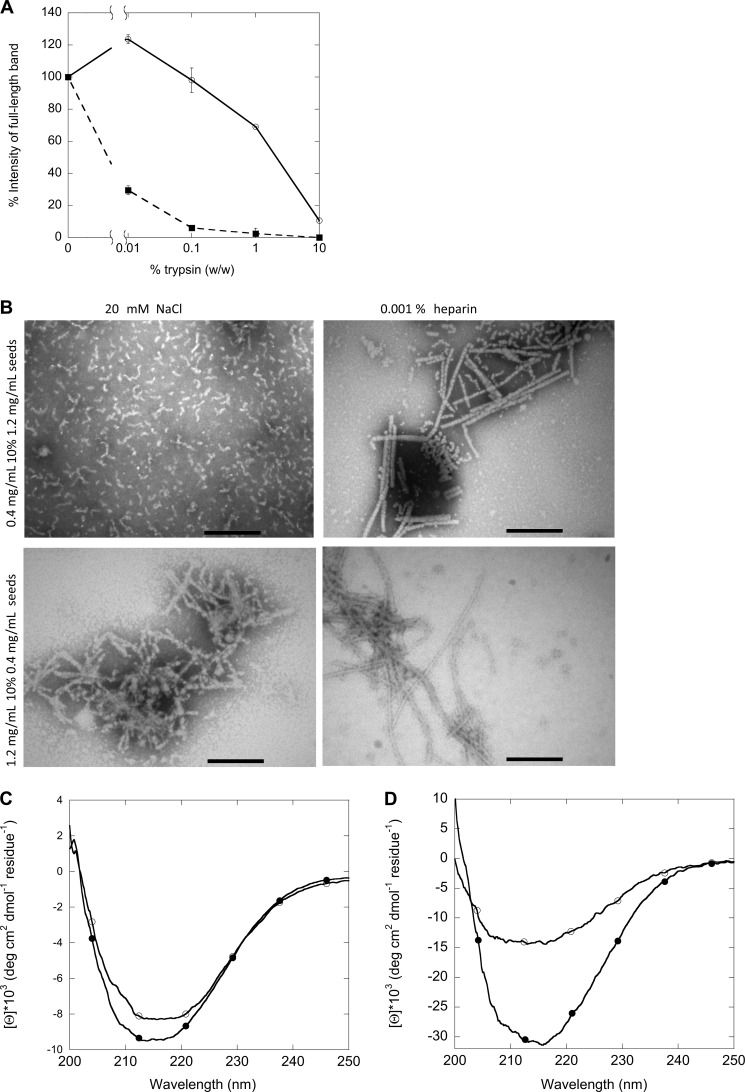
FIGURE 7.
Structural analysis of first and second generation fibrils formed at different concentrations with 20 mm NaCl or 0.001% heparin. A, shown is limited trypsin digestion of the two types of fibrils of FAS1–4 A546T, long and straight fibrils at 0.4 mg/ml 0.001% heparin (○) and short and curly fibrils at 1.2 mg/ml 20 mm NaCl (■). B, TEM analysis of the morphology is shown. C, shown are CD spectra of the secondary structure of fibrils of FAS1–4 A546T at 0.4 mg/ml seeded with 1.2 mg/ml 0.001% heparin fibrils with 20 mm NaCl (○) and 0.001% heparin (●). D, shown are CD spectra of the secondary structure of fibrils of FAS1–4 A546T at 1.2 mg/ml seeded with 0.4 mg/ml 0.001% heparin fibrils with 20 mm NaCl (○) and 0.001% heparin (●).

