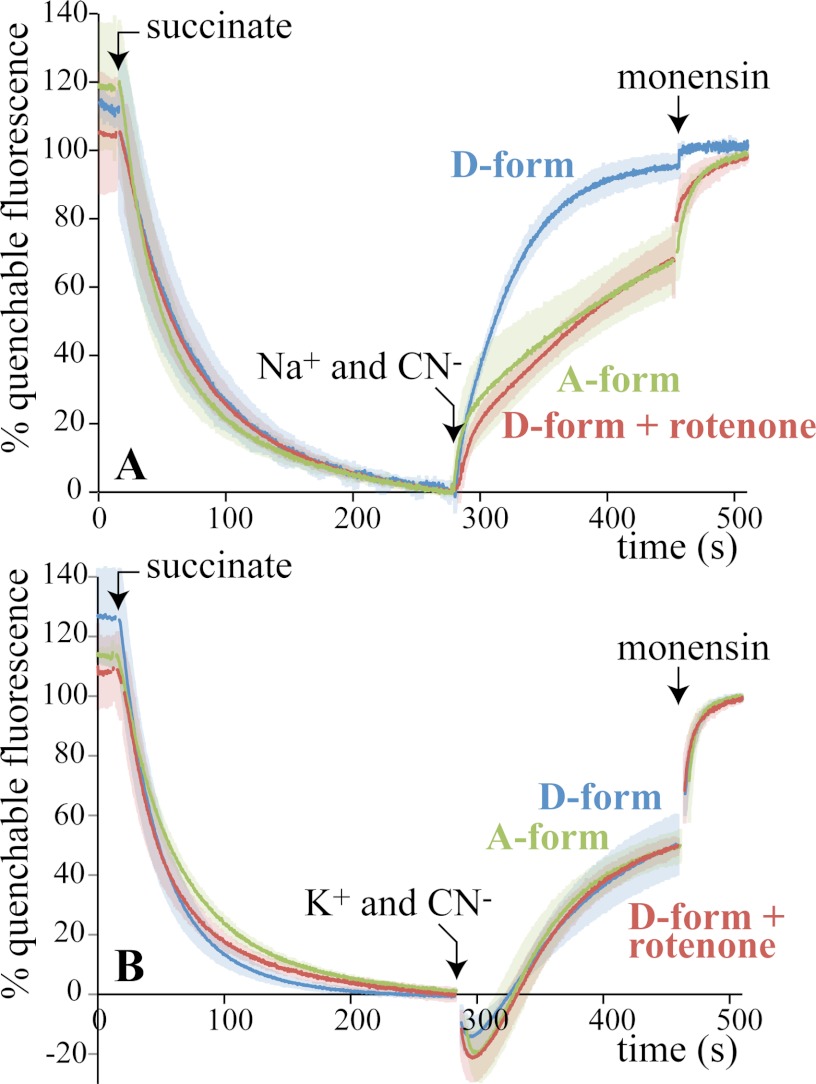
FIGURE 5.
Proton efflux from BtSMPs drives sodium ion uptake by deactive BtCI (Experiment B). A, BtSMPs were placed into buffer containing 10 mm Tris-SO4, 80 mm ChCl, 250 mm sucrose, pH 7.5, and 0.25 μm ACMA. The active/deactive status of complex I (A- or D-form) was set beforehand (see “Experimental Procedures”). Each trace is the average from at least three experiments, with the standard deviations indicated by shading. 1 mm succinate, 5 mm Na2SO4, 0.5 mm KCN, and 2 μg ml−1 monensin were added as indicated. 200 nm rotenone was added along with the Na2SO4 and KCN where indicated. The signal has been normalized to 100% at the end of the experiment (to compare the traces during the recovery phase) and to 0% before the addition of M+ and cyanide (where M+ = Li+, Na+, K+, or Rb+); ∼60% of the total fluorescence was quenchable. B, same as A except with 5 mm K2SO4 instead of 5 mm Na2SO4. Conditions are: 21 °C, ∼30 μg ml−1 protein.

