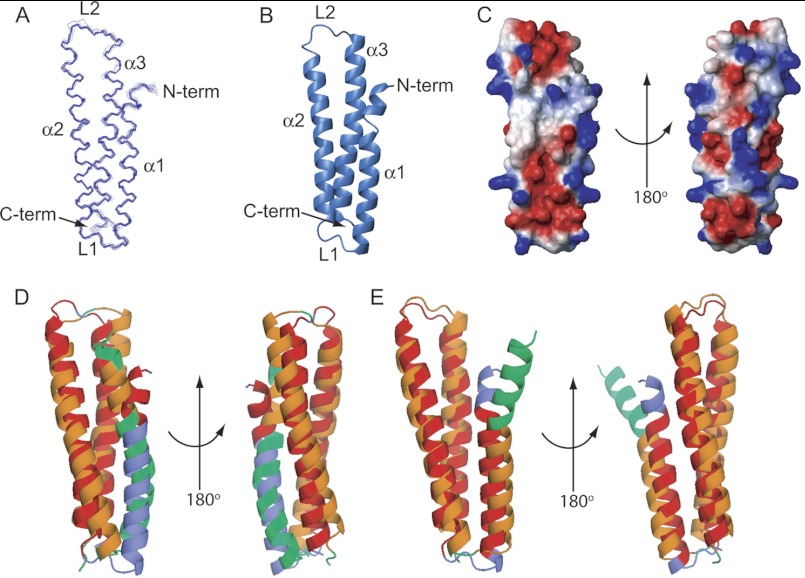
FIGURE 2.
The NMR solution structure of Blo t 21. A, an ensemble of 20 of the best structures of Blo t 21 solved by NMR. The N terminus and helices α1, α2, and α3 are labeled in the diagram. B, a ribbon diagram of the lowest energy conformer of Blo t 21. C, two orientations of the surface diagram of Blo t 21 with electrostatic potential as calculated by the program MOLMOL (32). D and E, superposition of Blo t 21 with Blo t 5 (D, Protein Data Bank code 2JMH) and Der p 5 (E, Protein Data Bank code 3MQ1) prepared using the TopMatch web service (28, 29). The query structure (Blo t 21) is colored blue, and the target sequences (Blo t 5 or Der p 5) are colored green. Pairs of structurally equivalent residues are colored orange (Blo t 21) and red (Blo t 5 or Der p 5). The figures were generated by the program PyMOL (33). N-term, N-terminal; C-term, C-terminal.

