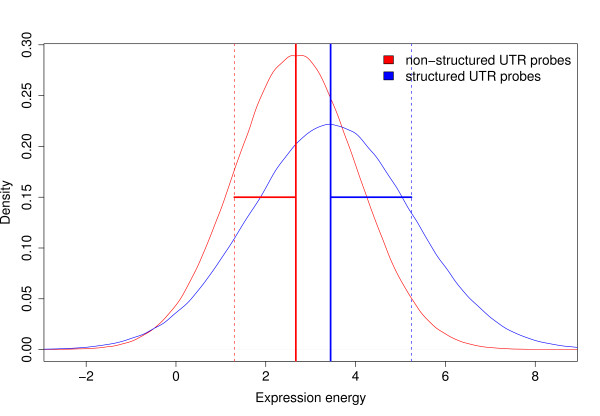
Figure 3.
Spatial expression divergence. Mean normal distribution of expression energy of structured and non-structured UTR probes in 115 brain regions. The larger standard deviation (horizontal lines) of transcripts with structured UTRs shows their higher spatial expression divergence in the brain.

