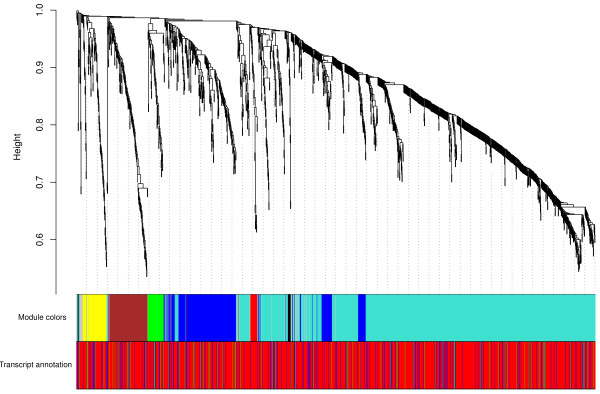
Figure 4.
Expression profile clusters of structured UTR probes. Hierarchical clustering of coronal expression energy profiles in 115 neuroanatomical regions of quality selected images of 165 Allen Mouse Brain Atlas probes with predicted 5’ UTR structures, 1,188 probes with predicted 3’ UTR structures and 66 probes with predicted structures in both UTRs. Probes within an individual module have similar expression patterns. The brain area(s) with the strongest correlated expression pattern(s) for each of the 8 modules are: isocortex (turquoise module), dorsal thalamus (yellow), epithalamus (gray), motor-related pons and midbrain in the brain stem (blue), striatum (brown), cerebellum (red), and midbrain (green and black). Probes in each module have additional (weaker) correlated expression pattern(s) in other brain areas and the turquoise, blue and black module represents probes with correlated expression patterns in the entire brain. The color coding of genomic locations (Transcript annotation) shows transcripts with a 5’ UTR structure as blue bars, transcript with a 3’ UTR structure as red bars and transcripts with predicted structures in both UTRs as green bars.

