
Figure 2.
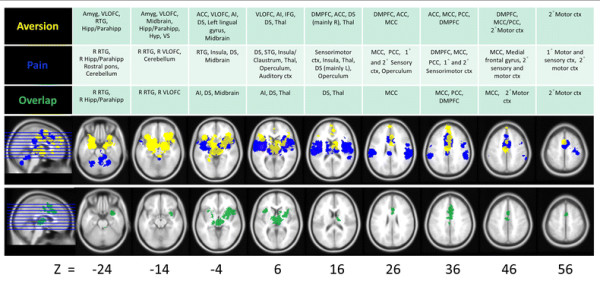
Overlap of pain- and aversion-related networks in humans. Results of meta-analyses for human pain- (blue) and aversion- (yellow) related studies (top row), overlapping activations (green; top row and isolated in bottom row), and a corresponding table of associated brain regions. All results are family-wise error rate whole-brain corrected at p < 0.05. See Table 3 for overlap coordinates.