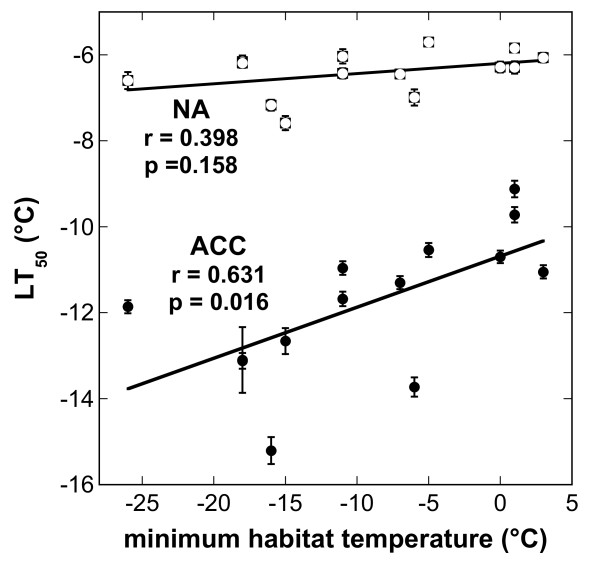
Figure 2.
Correlation between the average minimum habitat temperature recorded during the coldest month of the growth season (Table1) and the LT50of the leaves from either nonacclimated (NA) or cold acclimated plants (ACC). The lines were fitted to the data by linear regression analysis and the correlation coefficients and p-values are shown in the figure.

