
Figure 3.
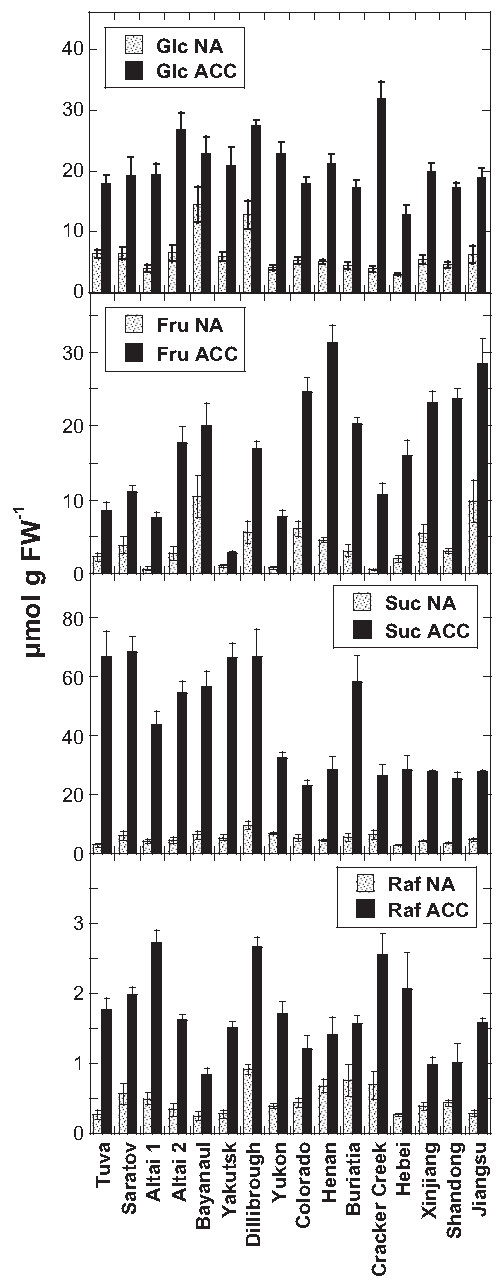
Contents of soluble sugars in the leaves of all investigated Thellungiella accessions. Leaves were harvested either before (NA) or after (ACC) cold acclimation. Note the different scales of the ordinates in the different panels. The accessions are ordered from the lowest LT50 after cold acclimation on the left to the highest on the right. The bars represent means ± SE from measurements of seven to 10 samples from two independent experiments.