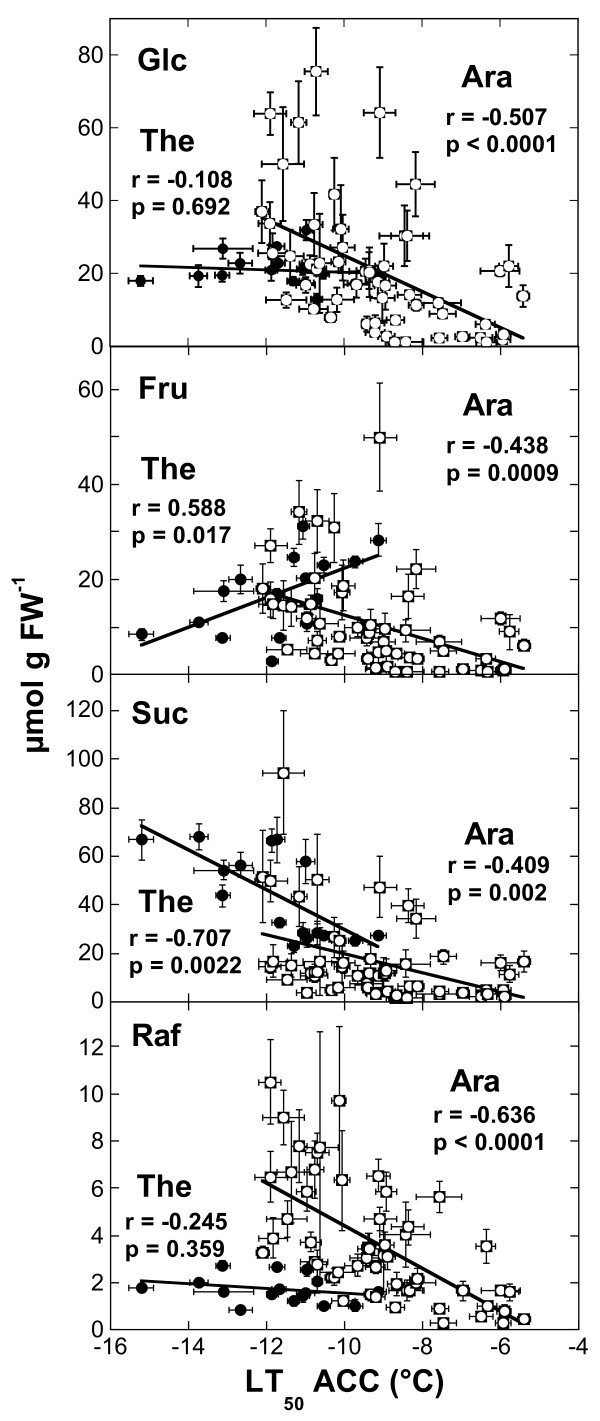
Figure 5.
Correlations among the contents of different soluble sugars in Arabidopsis and Thellungiella and their freezing tolerance after cold acclimation. The lines were fitted to the data by linear regression analysis and the correlation coefficients and p-values are shown in the panels. The data for Thellungiella (solid symbols) are the same as those shown in Fig. 1 for LT50 and in Fig. 3 for sugar contents. The data for Arabidopsis (open symbols) are taken from [13].

