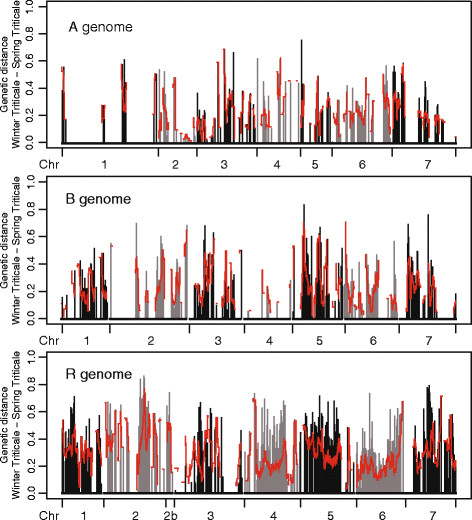
Figure 3.
Genetic distance between winter and spring types. Genetic distance between winter and spring types assessed for every marker. Grey and black colours separate different chromosomes (Chr), red lines indicate the mean genetic distance assessed by a sliding window approach (5 cM window used at 500 positions along the chromosomes).

