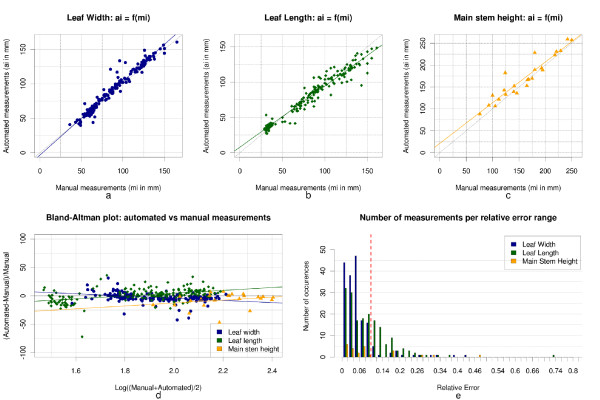
Figure 8 .
Statistical analysis: Comparison of mesh-based measurements with manual ground-truthing(a), (b), and (c) present scatter plots of the different phenotypic parameters evaluated by our pipeline against manual measurements. The squared Pearson correlation and intra-class correlation coefficients computed for the main stem height, leaf width, and leaf length measurements were , , , ICC s ≃0.941, ICC w ≃0.974, ICC l ≃0.967, (d) is the Bland-Altman plot of our datasets (i.e. the relative error against logarithm of the mean of two measurements), (e) illustrates the distribution of the error for each measurement type. The dotted red line represents the 10% relative error.

