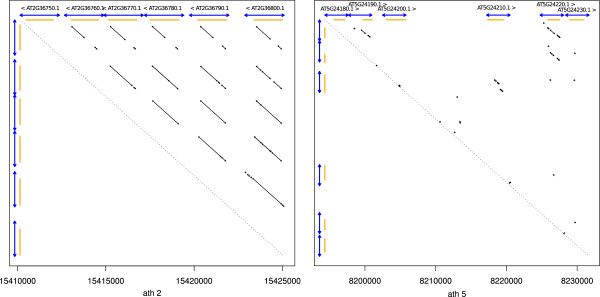
Figure 2.
Real tandem gene arrays, anchors and detection. These two dotplots illustrate the detectable DNA similarities in two different regions carrying reference tandem gene arrays in the Arabidopsis thaliana genome. The small black diagonal arrows represent detected DNA anchors. The X and Y axis carry intervals representing TAIR10 annotated regions (in orange) and detected tandem units (in blue). The left region is a simple situation, with a recent series of duplications with clear anchors, easily analysed by ReD Tandem. In the right region, local similarities become rare and weak, defining a more complex pattern, which is again deciphered by ReD Tandem.

