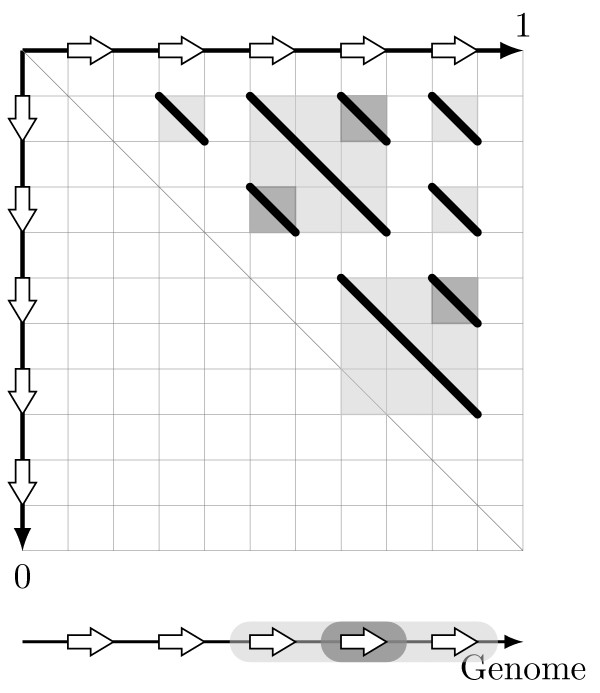
Figure 3.
Inconsistent chains. A dotplot representing a set of chains (black lines) violating required properties for consistent sets of t-chains. The square under each chain capture the two intervals defined by the chain. When two squares overlap, property (4) is violated since intervals overlap. When a square meets the central dotplot diagonal, property (2) is violated.

